Nota
Haga clic aquí para descargar el código de ejemplo completo
Cursor anotado #
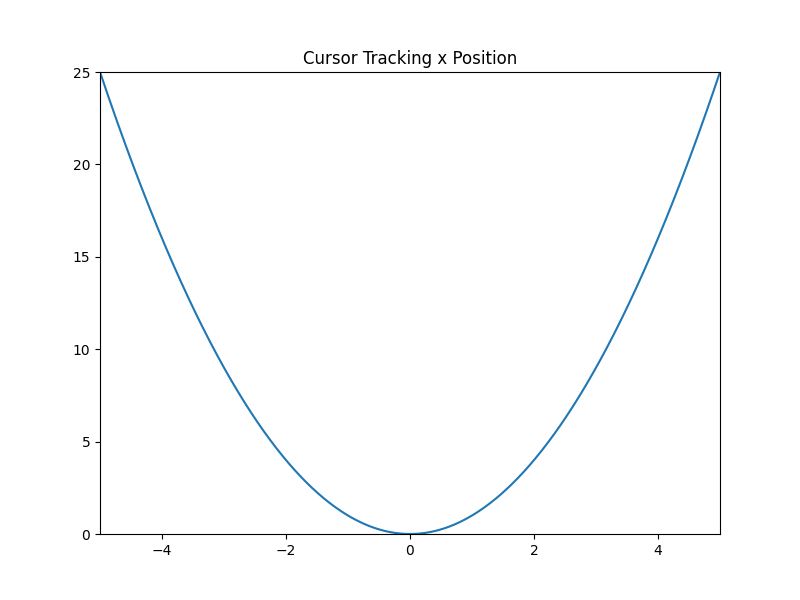
Muestra un cursor de datos que incluye un cuadro de texto, que muestra el punto de trazado cerca del puntero del mouse.
El nuevo cursor hereda Cursory demuestra la creación de nuevos widgets y sus devoluciones de llamada de eventos.
Véase también el cursor en forma de cruz , que implementa un cursor que rastrea los datos trazados, pero sin usar la herencia y sin mostrar las coordenadas actualmente rastreadas.
Nota
La figura relacionada con este ejemplo no muestra el cursor, porque esa figura se crea automáticamente en una cola de construcción, donde falta el primer movimiento del mouse, que activa la creación del cursor.
from matplotlib.widgets import Cursor
import numpy as np
import matplotlib.pyplot as plt


class AnnotatedCursor(Cursor):
    """
    A crosshair cursor like `~matplotlib.widgets.Cursor` with a text showing \
    the current coordinates.

    For the cursor to remain responsive you must keep a reference to it.
    The data of the axis specified as *dataaxis* must be in ascending
    order. Otherwise, the `numpy.searchsorted` call might fail and the text
    disappears. You can satisfy the requirement by sorting the data you plot.
    Usually the data is already sorted (if it was created e.g. using
    `numpy.linspace`), but e.g. scatter plots might cause this problem.
    The cursor sticks to the plotted line.

    Parameters
    ----------
    line : `matplotlib.lines.Line2D`
        The plot line from which the data coordinates are displayed.

    numberformat : `python format string <https://docs.python.org/3/\
    library/string.html#formatstrings>`_, optional, default: "{0:.4g};{1:.4g}"
        The displayed text is created by calling *format()* on this string
        with the two coordinates.

    offset : (float, float) default: (5, 5)
        The offset in display (pixel) coordinates of the text position
        relative to the cross hair.

    dataaxis : {"x", "y"}, optional, default: "x"
        If "x" is specified, the vertical cursor line sticks to the mouse
        pointer. The horizontal cursor line sticks to *line*
        at that x value. The text shows the data coordinates of *line*
        at the pointed x value. If you specify "y", it works in the opposite
        manner. But: For the "y" value, where the mouse points to, there might
        be multiple matching x values, if the plotted function is not biunique.
        Cursor and text coordinate will always refer to only one x value.
        So if you use the parameter value "y", ensure that your function is
        biunique.

    Other Parameters
    ----------------
    textprops : `matplotlib.text` properties as dictionary
        Specifies the appearance of the rendered text object.

    **cursorargs : `matplotlib.widgets.Cursor` properties
        Arguments passed to the internal `~matplotlib.widgets.Cursor` instance.
        The `matplotlib.axes.Axes` argument is mandatory! The parameter
        *useblit* can be set to *True* in order to achieve faster rendering.

    """

    def __init__(self, line, numberformat="{0:.4g};{1:.4g}", offset=(5, 5),
                 dataaxis='x', textprops=None, **cursorargs):
        if textprops is None:
            textprops = {}
        # The line object, for which the coordinates are displayed
        self.line = line
        # The format string, on which .format() is called for creating the text
        self.numberformat = numberformat
        # Text position offset
        self.offset = np.array(offset)
        # The axis in which the cursor position is looked up
        self.dataaxis = dataaxis

        # First call baseclass constructor.
        # Draws cursor and remembers background for blitting.
        # Saves ax as class attribute.
        super().__init__(**cursorargs)

        # Default value for position of text.
        self.set_position(self.line.get_xdata()[0], self.line.get_ydata()[0])
        # Create invisible animated text
        self.text = self.ax.text(
            self.ax.get_xbound()[0],
            self.ax.get_ybound()[0],
            "0, 0",
            animated=bool(self.useblit),
            visible=False, **textprops)
        # The position at which the cursor was last drawn
        self.lastdrawnplotpoint = None

    def onmove(self, event):
        """
        Overridden draw callback for cursor. Called when moving the mouse.
        """

        # Leave method under the same conditions as in overridden method
        if self.ignore(event):
            self.lastdrawnplotpoint = None
            return
        if not self.canvas.widgetlock.available(self):
            self.lastdrawnplotpoint = None
            return

        # If the mouse left drawable area, we now make the text invisible.
        # Baseclass will redraw complete canvas after, which makes both text
        # and cursor disappear.
        if event.inaxes != self.ax:
            self.lastdrawnplotpoint = None
            self.text.set_visible(False)
            super().onmove(event)
            return

        # Get the coordinates, which should be displayed as text,
        # if the event coordinates are valid.
        plotpoint = None
        if event.xdata is not None and event.ydata is not None:
            # Get plot point related to current x position.
            # These coordinates are displayed in text.
            plotpoint = self.set_position(event.xdata, event.ydata)
            # Modify event, such that the cursor is displayed on the
            # plotted line, not at the mouse pointer,
            # if the returned plot point is valid
            if plotpoint is not None:
                event.xdata = plotpoint[0]
                event.ydata = plotpoint[1]

        # If the plotpoint is given, compare to last drawn plotpoint and
        # return if they are the same.
        # Skip even the call of the base class, because this would restore the
        # background, draw the cursor lines and would leave us the job to
        # re-draw the text.
        if plotpoint is not None and plotpoint == self.lastdrawnplotpoint:
            return

        # Baseclass redraws canvas and cursor. Due to blitting,
        # the added text is removed in this call, because the
        # background is redrawn.
        super().onmove(event)

        # Check if the display of text is still necessary.
        # If not, just return.
        # This behaviour is also cloned from the base class.
        if not self.get_active() or not self.visible:
            return

        # Draw the widget, if event coordinates are valid.
        if plotpoint is not None:
            # Update position and displayed text.
            # Position: Where the event occurred.
            # Text: Determined by set_position() method earlier
            # Position is transformed to pixel coordinates,
            # an offset is added there and this is transformed back.
            temp = [event.xdata, event.ydata]
            temp = self.ax.transData.transform(temp)
            temp = temp + self.offset
            temp = self.ax.transData.inverted().transform(temp)
            self.text.set_position(temp)
            self.text.set_text(self.numberformat.format(*plotpoint))
            self.text.set_visible(self.visible)

            # Tell base class, that we have drawn something.
            # Baseclass needs to know, that it needs to restore a clean
            # background, if the cursor leaves our figure context.
            self.needclear = True

            # Remember the recently drawn cursor position, so events for the
            # same position (mouse moves slightly between two plot points)
            # can be skipped
            self.lastdrawnplotpoint = plotpoint
        # otherwise, make text invisible
        else:
            self.text.set_visible(False)

        # Draw changes. Cannot use _update method of baseclass,
        # because it would first restore the background, which
        # is done already and is not necessary.
        if self.useblit:
            self.ax.draw_artist(self.text)
            self.canvas.blit(self.ax.bbox)
        else:
            # If blitting is deactivated, the overridden _update call made
            # by the base class immediately returned.
            # We still have to draw the changes.
            self.canvas.draw_idle()

    def set_position(self, xpos, ypos):
        """
        Finds the coordinates, which have to be shown in text.

        The behaviour depends on the *dataaxis* attribute. Function looks
        up the matching plot coordinate for the given mouse position.

        Parameters
        ----------
        xpos : float
            The current x position of the cursor in data coordinates.
            Important if *dataaxis* is set to 'x'.
        ypos : float
            The current y position of the cursor in data coordinates.
            Important if *dataaxis* is set to 'y'.

        Returns
        -------
        ret : {2D array-like, None}
            The coordinates which should be displayed.
            *None* is the fallback value.
        """

        # Get plot line data
        xdata = self.line.get_xdata()
        ydata = self.line.get_ydata()

        # The dataaxis attribute decides, in which axis we look up which cursor
        # coordinate.
        if self.dataaxis == 'x':
            pos = xpos
            data = xdata
            lim = self.ax.get_xlim()
        elif self.dataaxis == 'y':
            pos = ypos
            data = ydata
            lim = self.ax.get_ylim()
        else:
            raise ValueError(f"The data axis specifier {self.dataaxis} should "
                             f"be 'x' or 'y'")

        # If position is valid and in valid plot data range.
        if pos is not None and lim[0] <= pos <= lim[-1]:
            # Find closest x value in sorted x vector.
            # This requires the plotted data to be sorted.
            index = np.searchsorted(data, pos)
            # Return none, if this index is out of range.
            if index < 0 or index >= len(data):
                return None
            # Return plot point as tuple.
            return (xdata[index], ydata[index])

        # Return none if there is no good related point for this x position.
        return None

    def clear(self, event):
        """
        Overridden clear callback for cursor, called before drawing the figure.
        """

        # The base class saves the clean background for blitting.
        # Text and cursor are invisible,
        # until the first mouse move event occurs.
        super().clear(event)
        if self.ignore(event):
            return
        self.text.set_visible(False)

    def _update(self):
        """
        Overridden method for either blitting or drawing the widget canvas.

        Passes call to base class if blitting is activated, only.
        In other cases, one draw_idle call is enough, which is placed
        explicitly in this class (see *onmove()*).
        In that case, `~matplotlib.widgets.Cursor` is not supposed to draw
        something using this method.
        """

        if self.useblit:
            super()._update()


fig, ax = plt.subplots(figsize=(8, 6))
ax.set_title("Cursor Tracking x Position")

x = np.linspace(-5, 5, 1000)
y = x**2

line, = ax.plot(x, y)
ax.set_xlim(-5, 5)
ax.set_ylim(0, 25)

# A minimum call
# Set useblit=True on most backends for enhanced performance
# and pass the ax parameter to the Cursor base class.
# cursor = AnnotatedCursor(line=lin[0], ax=ax, useblit=True)

# A more advanced call. Properties for text and lines are passed.
# Watch the passed color names and the color of cursor line and text, to
# relate the passed options to graphical elements.
# The dataaxis parameter is still the default.
cursor = AnnotatedCursor(
    line=line,
    numberformat="{0:.2f}\n{1:.2f}",
    dataaxis='x', offset=[10, 10],
    textprops={'color': 'blue', 'fontweight': 'bold'},
    ax=ax,
    useblit=True,
    color='red',
    linewidth=2)

plt.show()

Problemas con funciones no biúnicas #
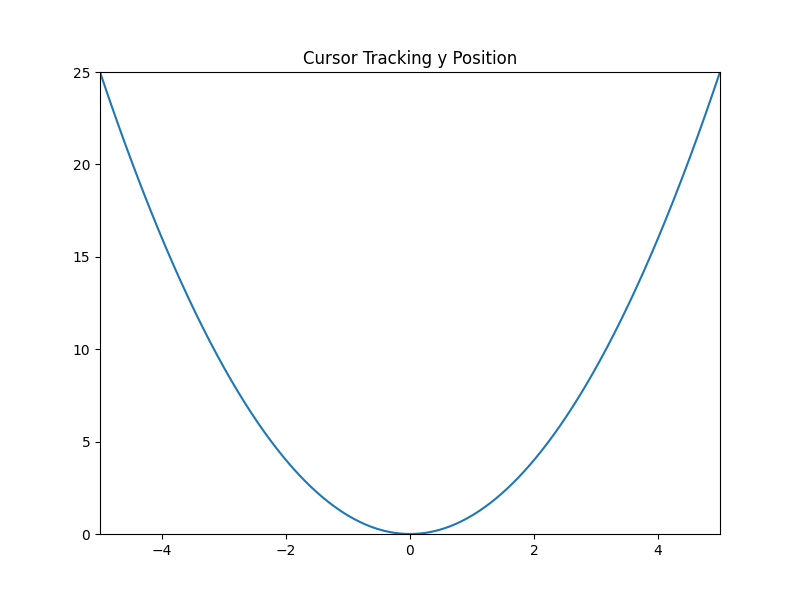
Una llamada que demuestra problemas con el parámetro dataaxis=y . El texto ahora busca el valor x coincidente para la posición actual del cursor y en lugar de viceversa. Pase el cursor a y=4. Hay dos valores de x que producen este valor de y: -2 y 2. La función es única, pero no biúnica. Solo se muestra un valor en el texto.
fig, ax = plt.subplots(figsize=(8, 6))
ax.set_title("Cursor Tracking y Position")

line, = ax.plot(x, y)
ax.set_xlim(-5, 5)
ax.set_ylim(0, 25)

cursor = AnnotatedCursor(
    line=line,
    numberformat="{0:.2f}\n{1:.2f}",
    dataaxis='y', offset=[10, 10],
    textprops={'color': 'blue', 'fontweight': 'bold'},
    ax=ax,
    useblit=True,
    color='red', linewidth=2)

plt.show()

Tiempo total de ejecución del script: ( 0 minutos 1.003 segundos)