Nota
Haga clic aquí para descargar el código de ejemplo completo
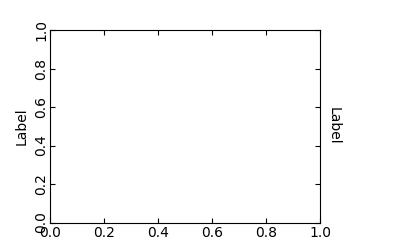
Dirección del eje simple01 #
import matplotlib.pyplot as plt
import mpl_toolkits.axisartist as axisartist

fig = plt.figure(figsize=(4, 2.5))
ax1 = fig.add_subplot(axes_class=axisartist.Axes)
fig.subplots_adjust(right=0.8)

ax1.axis["left"].major_ticklabels.set_axis_direction("top")
ax1.axis["left"].label.set_text("Label")

ax1.axis["right"].label.set_visible(True)
ax1.axis["right"].label.set_text("Label")
ax1.axis["right"].label.set_axis_direction("left")

plt.show()