Nota
Haga clic aquí para descargar el código de ejemplo completo
Familia de fuentes matemáticas #
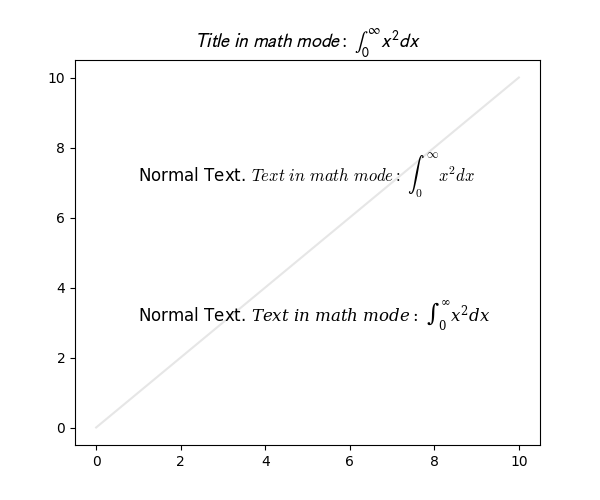
Un ejemplo simple que muestra el nuevo parámetro math_fontfamily que se puede usar para cambiar la familia de fuentes para cada elemento de texto individual en un gráfico.
Si no se establece ningún parámetro, se utilizará el valor global
rcParams["mathtext.fontset"](predeterminado: 'dejavusans').

import matplotlib.pyplot as plt


fig, ax = plt.subplots(figsize=(6, 5))

# A simple plot for the background.
ax.plot(range(11), color="0.9")

# A text mixing normal text and math text.
msg = (r"Normal Text. $Text\ in\ math\ mode:\ "
       r"\int_{0}^{\infty } x^2 dx$")

# Set the text in the plot.
ax.text(1, 7, msg, size=12, math_fontfamily='cm')

# Set another font for the next text.
ax.text(1, 3, msg, size=12, math_fontfamily='dejavuserif')

# *math_fontfamily* can be used in most places where there is text,
# like in the title:
ax.set_title(r"$Title\ in\ math\ mode:\ \int_{0}^{\infty } x^2 dx$",
             math_fontfamily='stixsans', size=14)

# Note that the normal text is not changed by *math_fontfamily*.
plt.show()