Nota
Haga clic aquí para descargar el código de ejemplo completo
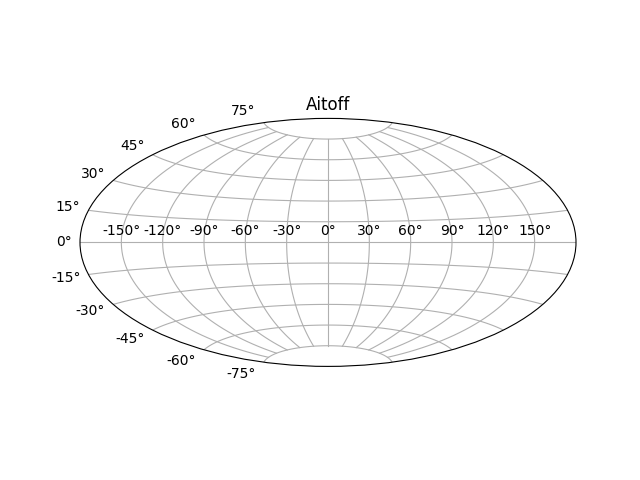
Proyecciones Geográficas #
Esto muestra 4 posibles proyecciones geográficas. Cartopy admite más proyecciones.
import matplotlib.pyplot as plt
plt.figure()
plt.subplot(projection="aitoff")
plt.title("Aitoff")
plt.grid(True)
plt.figure()
plt.subplot(projection="hammer")
plt.title("Hammer")
plt.grid(True)

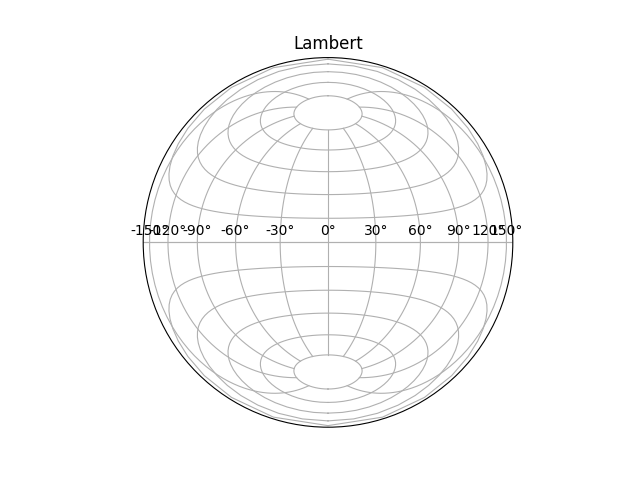
plt.figure()
plt.subplot(projection="lambert")
plt.title("Lambert")
plt.grid(True)
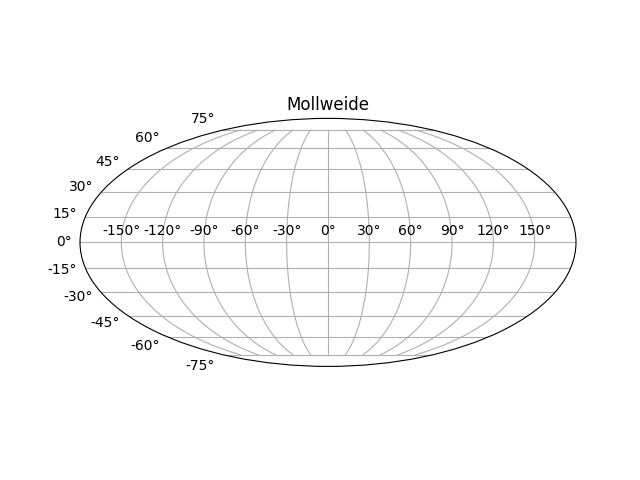
plt.figure()
plt.subplot(projection="mollweide")
plt.title("Mollweide")
plt.grid(True)

plt.show()
Tiempo total de ejecución del script: (0 minutos 1.707 segundos)