Nota
Haga clic aquí para descargar el código de ejemplo completo
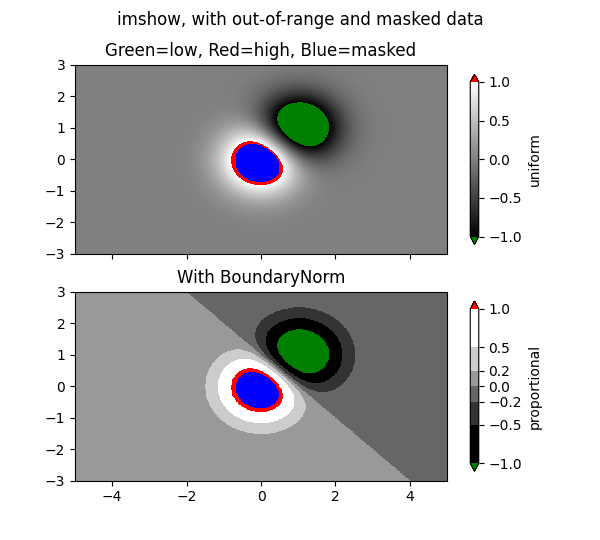
Imagen enmascarada #
imshow con entrada de matriz enmascarada y colores fuera de rango.
La segunda subtrama ilustra el uso de BoundaryNorm para obtener un efecto de contorno relleno.
import numpy as np
import matplotlib.pyplot as plt
import matplotlib.colors as colors

# compute some interesting data
x0, x1 = -5, 5
y0, y1 = -3, 3
x = np.linspace(x0, x1, 500)
y = np.linspace(y0, y1, 500)
X, Y = np.meshgrid(x, y)
Z1 = np.exp(-X**2 - Y**2)
Z2 = np.exp(-(X - 1)**2 - (Y - 1)**2)
Z = (Z1 - Z2) * 2

# Set up a colormap:
palette = plt.cm.gray.with_extremes(over='r', under='g', bad='b')
# Alternatively, we could use
# palette.set_bad(alpha = 0.0)
# to make the bad region transparent.  This is the default.
# If you comment out all the palette.set* lines, you will see
# all the defaults; under and over will be colored with the
# first and last colors in the palette, respectively.
Zm = np.ma.masked_where(Z > 1.2, Z)

# By setting vmin and vmax in the norm, we establish the
# range to which the regular palette color scale is applied.
# Anything above that range is colored based on palette.set_over, etc.

# set up the Axes objects
fig, (ax1, ax2) = plt.subplots(nrows=2, figsize=(6, 5.4))

# plot using 'continuous' colormap
im = ax1.imshow(Zm, interpolation='bilinear',
                cmap=palette,
                norm=colors.Normalize(vmin=-1.0, vmax=1.0),
                aspect='auto',
                origin='lower',
                extent=[x0, x1, y0, y1])
ax1.set_title('Green=low, Red=high, Blue=masked')
cbar = fig.colorbar(im, extend='both', shrink=0.9, ax=ax1)
cbar.set_label('uniform')
ax1.tick_params(axis='x', labelbottom=False)

# Plot using a small number of colors, with unevenly spaced boundaries.
im = ax2.imshow(Zm, interpolation='nearest',
                cmap=palette,
                norm=colors.BoundaryNorm([-1, -0.5, -0.2, 0, 0.2, 0.5, 1],
                                         ncolors=palette.N),
                aspect='auto',
                origin='lower',
                extent=[x0, x1, y0, y1])
ax2.set_title('With BoundaryNorm')
cbar = fig.colorbar(im, extend='both', spacing='proportional',
                    shrink=0.9, ax=ax2)
cbar.set_label('proportional')

fig.suptitle('imshow, with out-of-range and masked data')
plt.show()
Referencias
En este ejemplo se muestra el uso de las siguientes funciones, métodos, clases y módulos: