Nota
Haga clic aquí para descargar el código de ejemplo completo
Pastel Demo2 #
Haz un gráfico circular usando pie.
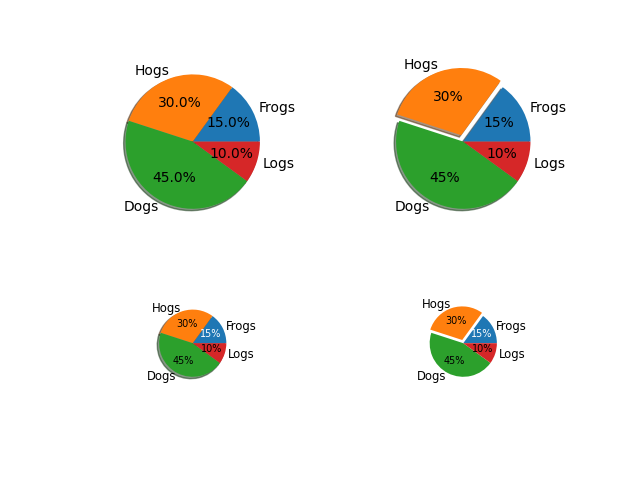
Este ejemplo demuestra algunas funciones de gráficos circulares como etiquetas, tamaño variable, etiquetado automático del porcentaje, compensación de un sector y adición de una sombra.
import matplotlib.pyplot as plt

# Some data
labels = 'Frogs', 'Hogs', 'Dogs', 'Logs'
fracs = [15, 30, 45, 10]

# Make figure and axes
fig, axs = plt.subplots(2, 2)

# A standard pie plot
axs[0, 0].pie(fracs, labels=labels, autopct='%1.1f%%', shadow=True)

# Shift the second slice using explode
axs[0, 1].pie(fracs, labels=labels, autopct='%.0f%%', shadow=True,
              explode=(0, 0.1, 0, 0))

# Adapt radius and text size for a smaller pie
patches, texts, autotexts = axs[1, 0].pie(fracs, labels=labels,
                                          autopct='%.0f%%',
                                          textprops={'size': 'smaller'},
                                          shadow=True, radius=0.5)
# Make percent texts even smaller
plt.setp(autotexts, size='x-small')
autotexts[0].set_color('white')

# Use a smaller explode and turn of the shadow for better visibility
patches, texts, autotexts = axs[1, 1].pie(fracs, labels=labels,
                                          autopct='%.0f%%',
                                          textprops={'size': 'smaller'},
                                          shadow=False, radius=0.5,
                                          explode=(0, 0.05, 0, 0))
plt.setp(autotexts, size='x-small')
autotexts[0].set_color('white')

plt.show()

Referencias
En este ejemplo se muestra el uso de las siguientes funciones, métodos, clases y módulos: