Nota
Haga clic aquí para descargar el código de ejemplo completo
Efecto de ruta TickedStroke #
Matplotlib patheffectsse puede usar para alterar la forma en que se dibujan las rutas a un nivel lo suficientemente bajo como para que puedan afectar casi cualquier cosa.
La guía de efectos de ruta detalla el uso de efectos de ruta.
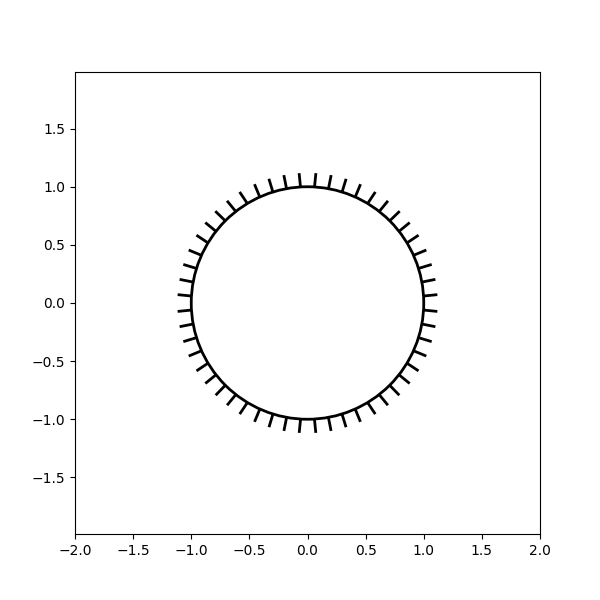
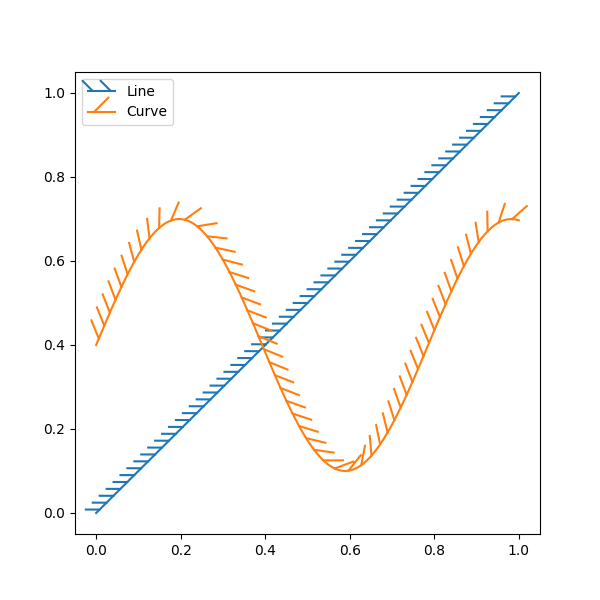
El TickedStrokeefecto de ruta ilustrado aquí dibuja una ruta con un estilo marcado. Se puede controlar el espaciado, la longitud y el ángulo de las marcas.
Consulte también el ejemplo de demostración de contorno .
Ver también los contornos en el ejemplo de optimización .
Aplicando TickedStroke a las rutas #
import matplotlib.patches as patches
from matplotlib.path import Path
import numpy as np
import matplotlib.pyplot as plt
import matplotlib.patheffects as patheffects

fig, ax = plt.subplots(figsize=(6, 6))
path = Path.unit_circle()
patch = patches.PathPatch(path, facecolor='none', lw=2, path_effects=[
    patheffects.withTickedStroke(angle=-90, spacing=10, length=1)])

ax.add_patch(patch)
ax.axis('equal')
ax.set_xlim(-2, 2)
ax.set_ylim(-2, 2)

plt.show()

Aplicando TickedStroke a las líneas #
fig, ax = plt.subplots(figsize=(6, 6))
ax.plot([0, 1], [0, 1], label="Line",
        path_effects=[patheffects.withTickedStroke(spacing=7, angle=135)])

nx = 101
x = np.linspace(0.0, 1.0, nx)
y = 0.3*np.sin(x*8) + 0.4
ax.plot(x, y, label="Curve", path_effects=[patheffects.withTickedStroke()])

ax.legend()

plt.show()

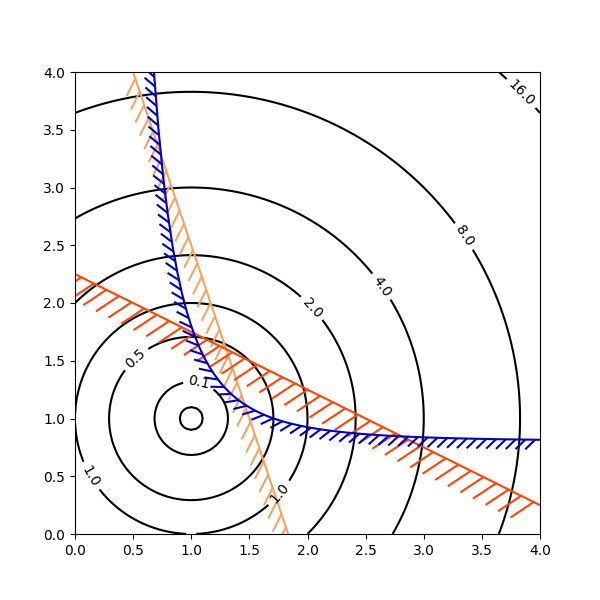
Aplicar TickedStroke a gráficos de contorno #
Gráfico de contorno con objetivo y restricciones. Las curvas generadas por contorno para representar una restricción típica en un problema de optimización deben trazarse con ángulos entre cero y 180 grados.
fig, ax = plt.subplots(figsize=(6, 6))

nx = 101
ny = 105

# Set up survey vectors
xvec = np.linspace(0.001, 4.0, nx)
yvec = np.linspace(0.001, 4.0, ny)

# Set up survey matrices.  Design disk loading and gear ratio.
x1, x2 = np.meshgrid(xvec, yvec)

# Evaluate some stuff to plot
obj = x1**2 + x2**2 - 2*x1 - 2*x2 + 2
g1 = -(3*x1 + x2 - 5.5)
g2 = -(x1 + 2*x2 - 4.5)
g3 = 0.8 + x1**-3 - x2

cntr = ax.contour(x1, x2, obj, [0.01, 0.1, 0.5, 1, 2, 4, 8, 16],
                  colors='black')
ax.clabel(cntr, fmt="%2.1f", use_clabeltext=True)

cg1 = ax.contour(x1, x2, g1, [0], colors='sandybrown')
plt.setp(cg1.collections,
         path_effects=[patheffects.withTickedStroke(angle=135)])

cg2 = ax.contour(x1, x2, g2, [0], colors='orangered')
plt.setp(cg2.collections,
         path_effects=[patheffects.withTickedStroke(angle=60, length=2)])

cg3 = ax.contour(x1, x2, g3, [0], colors='mediumblue')
plt.setp(cg3.collections,
         path_effects=[patheffects.withTickedStroke(spacing=7)])

ax.set_xlim(0, 4)
ax.set_ylim(0, 4)

plt.show()

Tiempo total de ejecución del script: (0 minutos 1.492 segundos)