Nota
Haga clic aquí para descargar el código de ejemplo completo
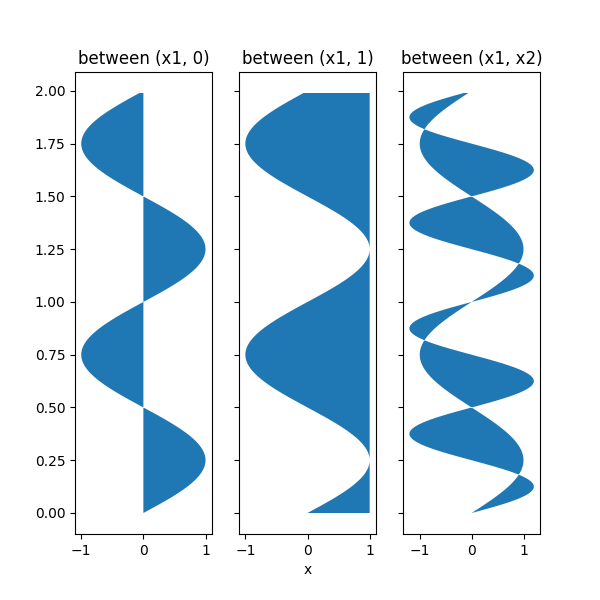
Demostración de relleno de Betweenx #
Usar fill_betweenxpara colorear a lo largo de la dirección horizontal entre dos curvas.
import matplotlib.pyplot as plt
import numpy as np


y = np.arange(0.0, 2, 0.01)
x1 = np.sin(2 * np.pi * y)
x2 = 1.2 * np.sin(4 * np.pi * y)

fig, [ax1, ax2, ax3] = plt.subplots(1, 3, sharey=True, figsize=(6, 6))

ax1.fill_betweenx(y, 0, x1)
ax1.set_title('between (x1, 0)')

ax2.fill_betweenx(y, x1, 1)
ax2.set_title('between (x1, 1)')
ax2.set_xlabel('x')

ax3.fill_betweenx(y, x1, x2)
ax3.set_title('between (x1, x2)')
Text(0.5, 1.0, 'between (x1, x2)')
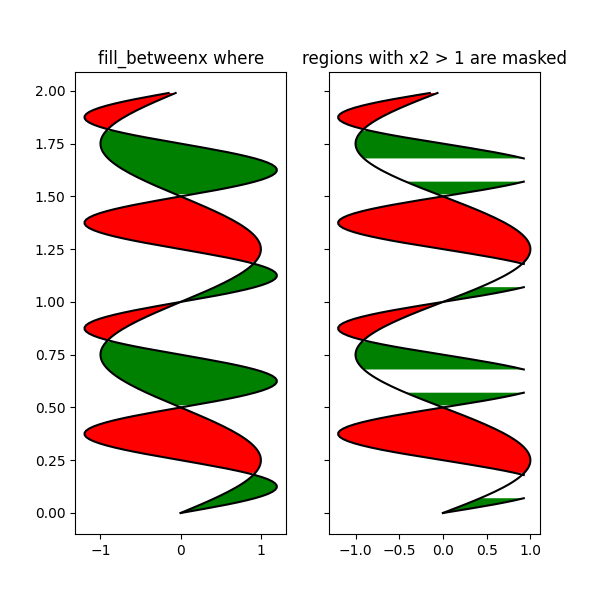
Ahora complete entre x1 y x2 donde se cumple una condición lógica. Tenga en cuenta que esto es diferente a llamar:
debido a los efectos de borde sobre múltiples regiones contiguas.
fig, [ax, ax1] = plt.subplots(1, 2, sharey=True, figsize=(6, 6))
ax.plot(x1, y, x2, y, color='black')
ax.fill_betweenx(y, x1, x2, where=x2 >= x1, facecolor='green')
ax.fill_betweenx(y, x1, x2, where=x2 <= x1, facecolor='red')
ax.set_title('fill_betweenx where')

# Test support for masked arrays.
x2 = np.ma.masked_greater(x2, 1.0)
ax1.plot(x1, y, x2, y, color='black')
ax1.fill_betweenx(y, x1, x2, where=x2 >= x1, facecolor='green')
ax1.fill_betweenx(y, x1, x2, where=x2 <= x1, facecolor='red')
ax1.set_title('regions with x2 > 1 are masked')
Text(0.5, 1.0, 'regions with x2 > 1 are masked')
Este ejemplo ilustra un problema; debido a la cuadrícula de datos, hay triángulos vacíos no deseados en los puntos de cruce. Una solución de fuerza bruta sería interpolar todas las matrices en una cuadrícula muy fina antes de trazar.
plt.show()
Tiempo total de ejecución del script: (0 minutos 1.113 segundos)