Nota
Haga clic aquí para descargar el código de ejemplo completo
Demostración de diagrama de caja #
Código de diagrama de caja de ejemplo
import numpy as np
import matplotlib.pyplot as plt

# Fixing random state for reproducibility
np.random.seed(19680801)

# fake up some data
spread = np.random.rand(50) * 100
center = np.ones(25) * 50
flier_high = np.random.rand(10) * 100 + 100
flier_low = np.random.rand(10) * -100
data = np.concatenate((spread, center, flier_high, flier_low))
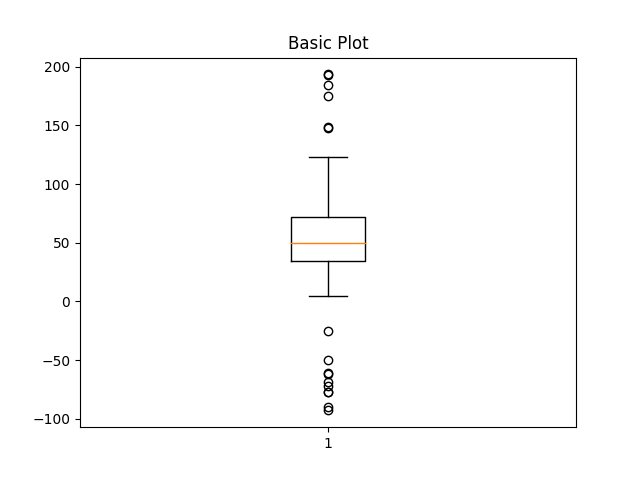
fig1, ax1 = plt.subplots()
ax1.set_title('Basic Plot')
ax1.boxplot(data)
{'whiskers': [<matplotlib.lines.Line2D object at 0x7f2cfa981690>, <matplotlib.lines.Line2D object at 0x7f2d00e97cd0>], 'caps': [<matplotlib.lines.Line2D object at 0x7f2d00e94490>, <matplotlib.lines.Line2D object at 0x7f2cf9ed3b50>], 'boxes': [<matplotlib.lines.Line2D object at 0x7f2cfa982380>], 'medians': [<matplotlib.lines.Line2D object at 0x7f2d01443d00>], 'fliers': [<matplotlib.lines.Line2D object at 0x7f2d01443d90>], 'means': []}
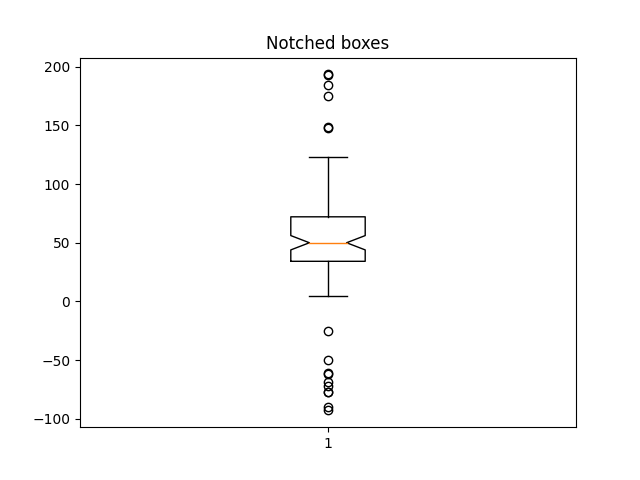
fig2, ax2 = plt.subplots()
ax2.set_title('Notched boxes')
ax2.boxplot(data, notch=True)
{'whiskers': [<matplotlib.lines.Line2D object at 0x7f2cfa921b10>, <matplotlib.lines.Line2D object at 0x7f2cfa920b50>], 'caps': [<matplotlib.lines.Line2D object at 0x7f2cfa920550>, <matplotlib.lines.Line2D object at 0x7f2cfa922590>], 'boxes': [<matplotlib.lines.Line2D object at 0x7f2cfa923760>], 'medians': [<matplotlib.lines.Line2D object at 0x7f2cfa922bc0>], 'fliers': [<matplotlib.lines.Line2D object at 0x7f2cfa920160>], 'means': []}
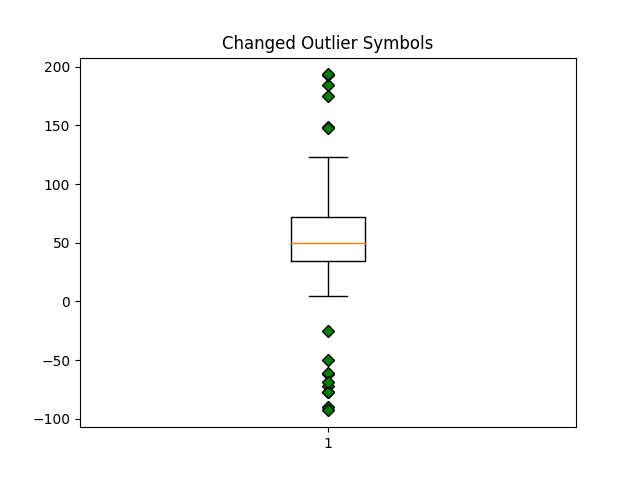
green_diamond = dict(markerfacecolor='g', marker='D')
fig3, ax3 = plt.subplots()
ax3.set_title('Changed Outlier Symbols')
ax3.boxplot(data, flierprops=green_diamond)
{'whiskers': [<matplotlib.lines.Line2D object at 0x7f2cfae88790>, <matplotlib.lines.Line2D object at 0x7f2cfb2d7f70>], 'caps': [<matplotlib.lines.Line2D object at 0x7f2cfb2d6a70>, <matplotlib.lines.Line2D object at 0x7f2cfb2d4700>], 'boxes': [<matplotlib.lines.Line2D object at 0x7f2cfae8bd90>], 'medians': [<matplotlib.lines.Line2D object at 0x7f2cfb2d61d0>], 'fliers': [<matplotlib.lines.Line2D object at 0x7f2cfb2d7b20>], 'means': []}
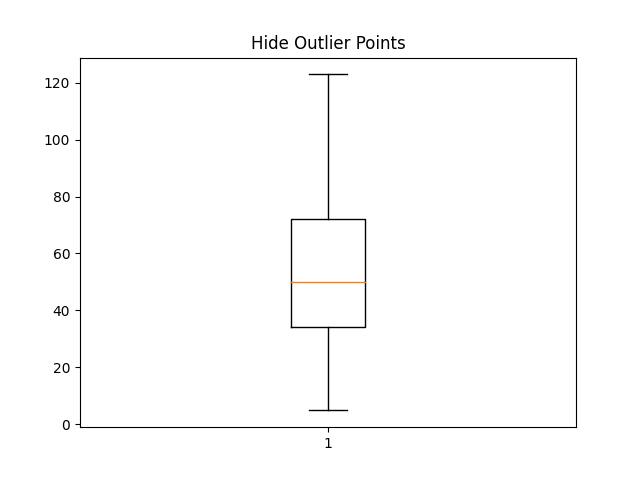
fig4, ax4 = plt.subplots()
ax4.set_title('Hide Outlier Points')
ax4.boxplot(data, showfliers=False)
{'whiskers': [<matplotlib.lines.Line2D object at 0x7f2cfaa35ba0>, <matplotlib.lines.Line2D object at 0x7f2cfaa37520>], 'caps': [<matplotlib.lines.Line2D object at 0x7f2cfaa35cc0>, <matplotlib.lines.Line2D object at 0x7f2cfaa378e0>], 'boxes': [<matplotlib.lines.Line2D object at 0x7f2cfaa37af0>], 'medians': [<matplotlib.lines.Line2D object at 0x7f2cfaa36f20>], 'fliers': [], 'means': []}
red_square = dict(markerfacecolor='r', marker='s')
fig5, ax5 = plt.subplots()
ax5.set_title('Horizontal Boxes')
ax5.boxplot(data, vert=False, flierprops=red_square)
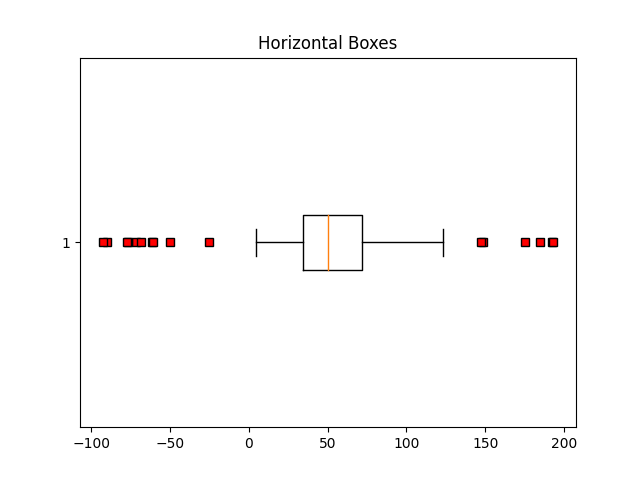
{'whiskers': [<matplotlib.lines.Line2D object at 0x7f2d0106f790>, <matplotlib.lines.Line2D object at 0x7f2d0106ee30>], 'caps': [<matplotlib.lines.Line2D object at 0x7f2d0106ee60>, <matplotlib.lines.Line2D object at 0x7f2d0106edd0>], 'boxes': [<matplotlib.lines.Line2D object at 0x7f2d0106ff70>], 'medians': [<matplotlib.lines.Line2D object at 0x7f2d0106c670>], 'fliers': [<matplotlib.lines.Line2D object at 0x7f2d0106d120>], 'means': []}
fig6, ax6 = plt.subplots()
ax6.set_title('Shorter Whisker Length')
ax6.boxplot(data, flierprops=red_square, vert=False, whis=0.75)
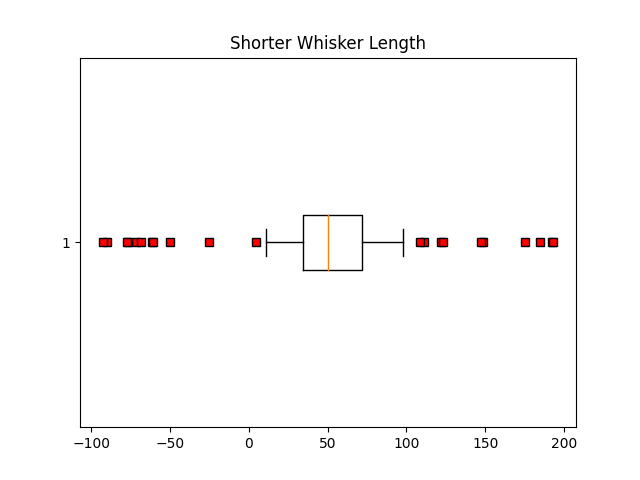
{'whiskers': [<matplotlib.lines.Line2D object at 0x7f2d00d30100>, <matplotlib.lines.Line2D object at 0x7f2d00d32320>], 'caps': [<matplotlib.lines.Line2D object at 0x7f2d00d33790>, <matplotlib.lines.Line2D object at 0x7f2d00d324d0>], 'boxes': [<matplotlib.lines.Line2D object at 0x7f2d00d32530>], 'medians': [<matplotlib.lines.Line2D object at 0x7f2d00d30e80>], 'fliers': [<matplotlib.lines.Line2D object at 0x7f2d00d33490>], 'means': []}
Falsificar algunos datos más
spread = np.random.rand(50) * 100
center = np.ones(25) * 40
flier_high = np.random.rand(10) * 100 + 100
flier_low = np.random.rand(10) * -100
d2 = np.concatenate((spread, center, flier_high, flier_low))
Hacer una matriz 2-D solo funciona si todas las columnas tienen la misma longitud. Si no lo son, utilice una lista en su lugar. En realidad, esto es más eficiente porque boxplot convierte una matriz 2-D en una lista de vectores internamente de todos modos.
data = [data, d2, d2[::2]]
fig7, ax7 = plt.subplots()
ax7.set_title('Multiple Samples with Different sizes')
ax7.boxplot(data)

plt.show()

Referencias
En este ejemplo se muestra el uso de las siguientes funciones, métodos, clases y módulos:
Tiempo total de ejecución del script: (0 minutos 1,863 segundos)