Nota
Haga clic aquí para descargar el código de ejemplo completo
Cambiar los colores de las líneas que se cruzan con un cuadro #
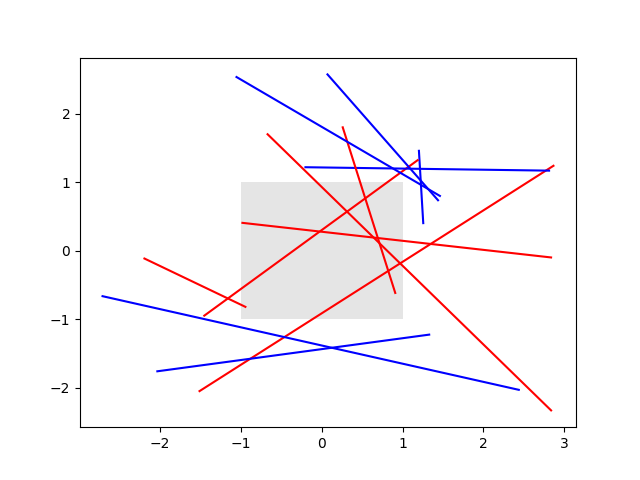
Las líneas que intersecan el rectángulo están coloreadas en rojo, mientras que las otras se dejan como líneas azules. Este ejemplo muestra la intersects_bboxfunción.

import numpy as np
import matplotlib.pyplot as plt
from matplotlib.transforms import Bbox
from matplotlib.path import Path

# Fixing random state for reproducibility
np.random.seed(19680801)


left, bottom, width, height = (-1, -1, 2, 2)
rect = plt.Rectangle((left, bottom), width, height,
                     facecolor="black", alpha=0.1)

fig, ax = plt.subplots()
ax.add_patch(rect)

bbox = Bbox.from_bounds(left, bottom, width, height)

for i in range(12):
    vertices = (np.random.random((2, 2)) - 0.5) * 6.0
    path = Path(vertices)
    if path.intersects_bbox(bbox):
        color = 'r'
    else:
        color = 'b'
    ax.plot(vertices[:, 0], vertices[:, 1], color=color)

plt.show()