Nota
Haga clic aquí para descargar el código de ejemplo completo
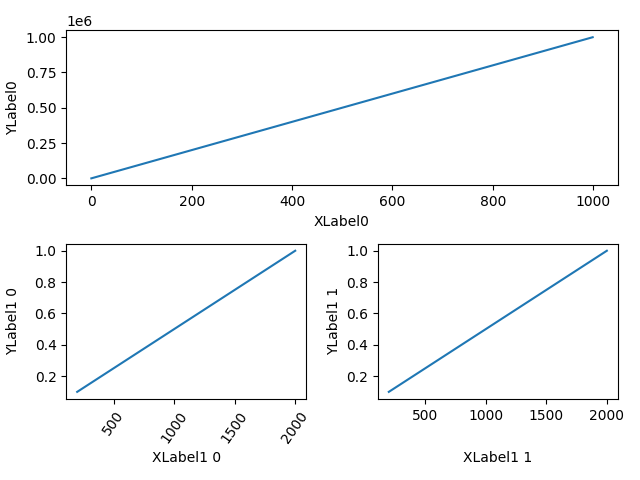
Alineación de etiquetas #
Alinear xlabel e ylabel usando Figure.align_xlabelsy
Figure.align_ylabels
Figure.align_labelsenvuelve estas dos funciones.
Tenga en cuenta que xlabel "XLabel1 1" normalmente estaría mucho más cerca del eje x, y "YLabel1 0" estaría mucho más cerca del eje y de sus respectivos ejes.
import matplotlib.pyplot as plt
import numpy as np
import matplotlib.gridspec as gridspec

fig = plt.figure(tight_layout=True)
gs = gridspec.GridSpec(2, 2)

ax = fig.add_subplot(gs[0, :])
ax.plot(np.arange(0, 1e6, 1000))
ax.set_ylabel('YLabel0')
ax.set_xlabel('XLabel0')

for i in range(2):
    ax = fig.add_subplot(gs[1, i])
    ax.plot(np.arange(1., 0., -0.1) * 2000., np.arange(1., 0., -0.1))
    ax.set_ylabel('YLabel1 %d' % i)
    ax.set_xlabel('XLabel1 %d' % i)
    if i == 0:
        ax.tick_params(axis='x', rotation=55)
fig.align_labels()  # same as fig.align_xlabels(); fig.align_ylabels()

plt.show()