Nota
Haga clic aquí para descargar el código de ejemplo completo
Estilos de conexión para anotaciones #
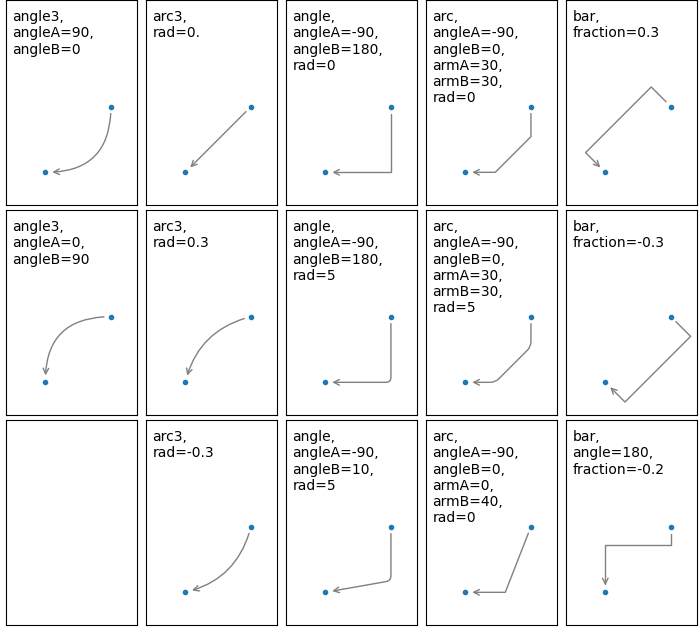
Al crear una anotación usando annotate, la forma de la flecha se puede controlar a través del parámetro connectionstyle de arrowprops . Para más detalles ver la descripción de FancyArrowPatch.
import matplotlib.pyplot as plt


def demo_con_style(ax, connectionstyle):
    x1, y1 = 0.3, 0.2
    x2, y2 = 0.8, 0.6

    ax.plot([x1, x2], [y1, y2], ".")
    ax.annotate("",
                xy=(x1, y1), xycoords='data',
                xytext=(x2, y2), textcoords='data',
                arrowprops=dict(arrowstyle="->", color="0.5",
                                shrinkA=5, shrinkB=5,
                                patchA=None, patchB=None,
                                connectionstyle=connectionstyle,
                                ),
                )

    ax.text(.05, .95, connectionstyle.replace(",", ",\n"),
            transform=ax.transAxes, ha="left", va="top")


fig, axs = plt.subplots(3, 5, figsize=(7, 6.3), constrained_layout=True)
demo_con_style(axs[0, 0], "angle3,angleA=90,angleB=0")
demo_con_style(axs[1, 0], "angle3,angleA=0,angleB=90")
demo_con_style(axs[0, 1], "arc3,rad=0.")
demo_con_style(axs[1, 1], "arc3,rad=0.3")
demo_con_style(axs[2, 1], "arc3,rad=-0.3")
demo_con_style(axs[0, 2], "angle,angleA=-90,angleB=180,rad=0")
demo_con_style(axs[1, 2], "angle,angleA=-90,angleB=180,rad=5")
demo_con_style(axs[2, 2], "angle,angleA=-90,angleB=10,rad=5")
demo_con_style(axs[0, 3], "arc,angleA=-90,angleB=0,armA=30,armB=30,rad=0")
demo_con_style(axs[1, 3], "arc,angleA=-90,angleB=0,armA=30,armB=30,rad=5")
demo_con_style(axs[2, 3], "arc,angleA=-90,angleB=0,armA=0,armB=40,rad=0")
demo_con_style(axs[0, 4], "bar,fraction=0.3")
demo_con_style(axs[1, 4], "bar,fraction=-0.3")
demo_con_style(axs[2, 4], "bar,angle=180,fraction=-0.2")

for ax in axs.flat:
    ax.set(xlim=(0, 1), ylim=(0, 1.25), xticks=[], yticks=[], aspect=1.25)
fig.set_constrained_layout_pads(wspace=0, hspace=0, w_pad=0, h_pad=0)

plt.show()

Referencias
En este ejemplo se muestra el uso de las siguientes funciones, métodos, clases y módulos:
Tiempo total de ejecución del script: (0 minutos 1,104 segundos)