Nota
Haga clic aquí para descargar el código de ejemplo completo
Submuestreo de barra de error #
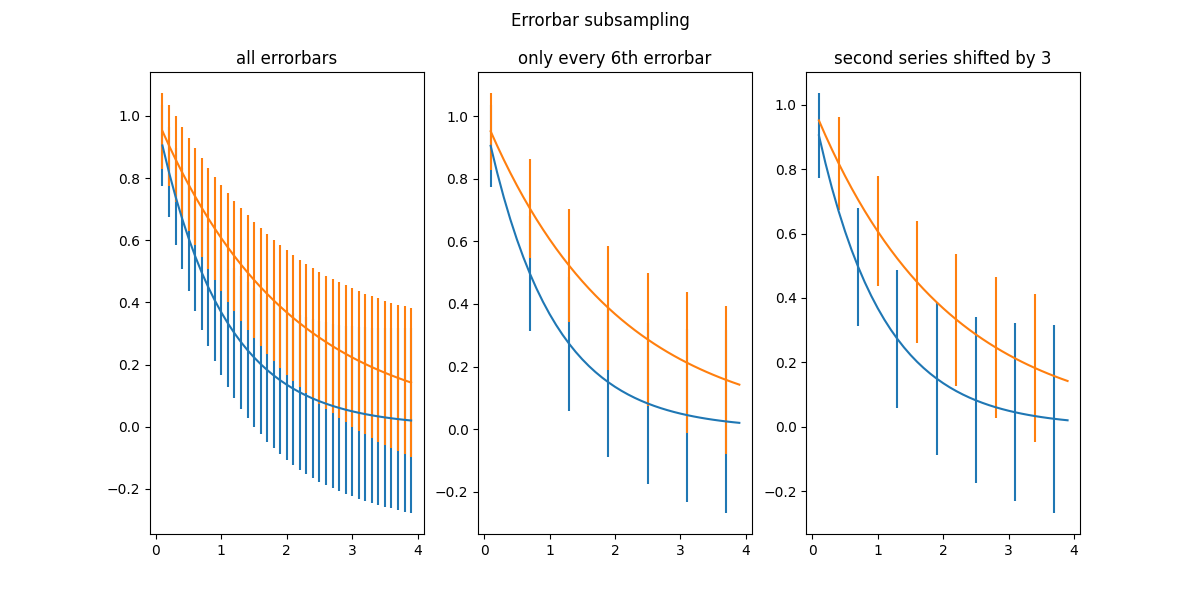
El parámetro errorevery of Axes.errorbarse puede usar para dibujar barras de error solo en un subconjunto de puntos de datos. Esto es particularmente útil si hay muchos puntos de datos con errores similares.

import numpy as np
import matplotlib.pyplot as plt

# example data
x = np.arange(0.1, 4, 0.1)
y1 = np.exp(-1.0 * x)
y2 = np.exp(-0.5 * x)

# example variable error bar values
y1err = 0.1 + 0.1 * np.sqrt(x)
y2err = 0.1 + 0.1 * np.sqrt(x/2)


fig, (ax0, ax1, ax2) = plt.subplots(nrows=1, ncols=3, sharex=True,
                                    figsize=(12, 6))

ax0.set_title('all errorbars')
ax0.errorbar(x, y1, yerr=y1err)
ax0.errorbar(x, y2, yerr=y2err)

ax1.set_title('only every 6th errorbar')
ax1.errorbar(x, y1, yerr=y1err, errorevery=6)
ax1.errorbar(x, y2, yerr=y2err, errorevery=6)

ax2.set_title('second series shifted by 3')
ax2.errorbar(x, y1, yerr=y1err, errorevery=(0, 6))
ax2.errorbar(x, y2, yerr=y2err, errorevery=(3, 6))

fig.suptitle('Errorbar subsampling')
plt.show()