Nota
Haga clic aquí para descargar el código de ejemplo completo
Colección de línea #
Trazado de líneas con Matplotlib.
LineCollectionpermite trazar varias líneas en una figura. A continuación te mostramos algunas de sus propiedades.
import matplotlib.pyplot as plt
from matplotlib.collections import LineCollection
from matplotlib import colors as mcolors
import numpy as np
# In order to efficiently plot many lines in a single set of axes,
# Matplotlib has the ability to add the lines all at once. Here is a
# simple example showing how it is done.
x = np.arange(100)
# Here are many sets of y to plot vs. x
ys = x[:50, np.newaxis] + x[np.newaxis, :]
segs = np.zeros((50, 100, 2))
segs[:, :, 1] = ys
segs[:, :, 0] = x
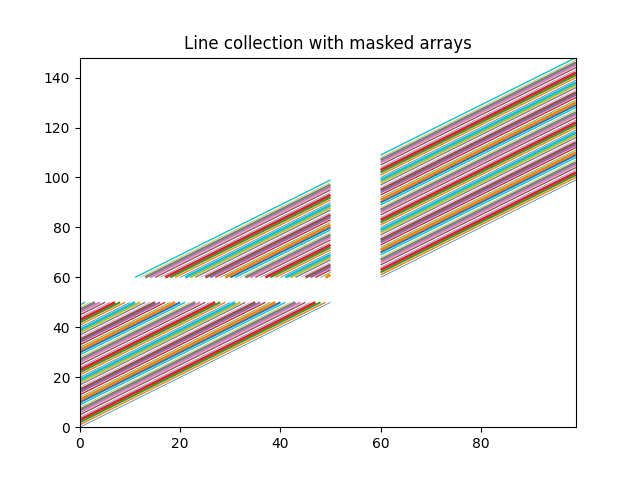
# Mask some values to test masked array support:
segs = np.ma.masked_where((segs > 50) & (segs < 60), segs)
# We need to set the plot limits.
fig, ax = plt.subplots()
ax.set_xlim(x.min(), x.max())
ax.set_ylim(ys.min(), ys.max())
# *colors* is sequence of rgba tuples.
# *linestyle* is a string or dash tuple. Legal string values are
# solid|dashed|dashdot|dotted. The dash tuple is (offset, onoffseq) where
# onoffseq is an even length tuple of on and off ink in points. If linestyle
# is omitted, 'solid' is used.
# See `matplotlib.collections.LineCollection` for more information.
colors = [mcolors.to_rgba(c)
for c in plt.rcParams['axes.prop_cycle'].by_key()['color']]
line_segments = LineCollection(segs, linewidths=(0.5, 1, 1.5, 2),
colors=colors, linestyle='solid')
ax.add_collection(line_segments)
ax.set_title('Line collection with masked arrays')
plt.show()
Para trazar de manera eficiente muchas líneas en un solo conjunto de ejes, Matplotlib tiene la capacidad de agregar todas las líneas a la vez. Aquí hay un ejemplo simple que muestra cómo se hace.
N = 50
x = np.arange(N)
# Here are many sets of y to plot vs. x
ys = [x + i for i in x]
# We need to set the plot limits, they will not autoscale
fig, ax = plt.subplots()
ax.set_xlim(np.min(x), np.max(x))
ax.set_ylim(np.min(ys), np.max(ys))
# colors is sequence of rgba tuples
# linestyle is a string or dash tuple. Legal string values are
# solid|dashed|dashdot|dotted. The dash tuple is (offset, onoffseq)
# where onoffseq is an even length tuple of on and off ink in points.
# If linestyle is omitted, 'solid' is used
# See `matplotlib.collections.LineCollection` for more information
# Make a sequence of (x, y) pairs.
line_segments = LineCollection([np.column_stack([x, y]) for y in ys],
linewidths=(0.5, 1, 1.5, 2),
linestyles='solid')
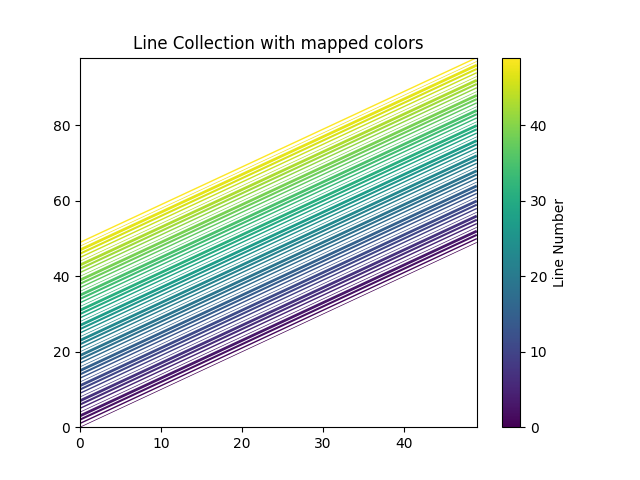
line_segments.set_array(x)
ax.add_collection(line_segments)
axcb = fig.colorbar(line_segments)
axcb.set_label('Line Number')
ax.set_title('Line Collection with mapped colors')
plt.sci(line_segments) # This allows interactive changing of the colormap.
plt.show()
Referencias
En este ejemplo se muestra el uso de las siguientes funciones, métodos, clases y módulos:
Tiempo total de ejecución del script: (0 minutos 1.012 segundos)