Nota
Haga clic aquí para descargar el código de ejemplo completo
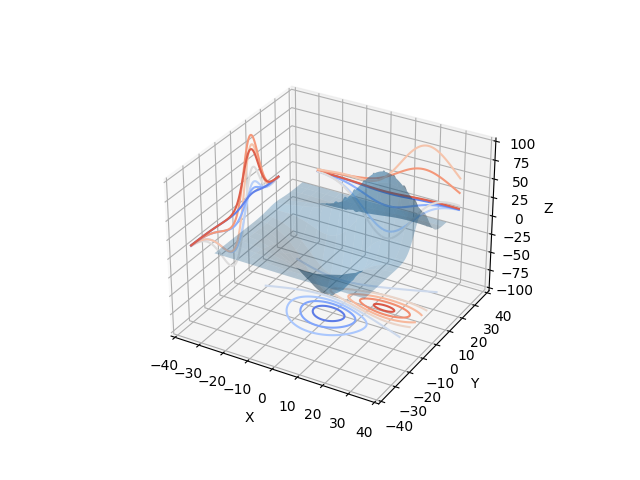
Proyectar perfiles de contorno en un gráfico #
Demuestra la visualización de una superficie 3D mientras también proyecta 'perfiles' de contorno en las 'paredes' del gráfico.
Ver contourf3d_demo2 para la versión completa.
from mpl_toolkits.mplot3d import axes3d
import matplotlib.pyplot as plt
from matplotlib import cm

ax = plt.figure().add_subplot(projection='3d')
X, Y, Z = axes3d.get_test_data(0.05)

# Plot the 3D surface
ax.plot_surface(X, Y, Z, rstride=8, cstride=8, alpha=0.3)

# Plot projections of the contours for each dimension.  By choosing offsets
# that match the appropriate axes limits, the projected contours will sit on
# the 'walls' of the graph.
ax.contour(X, Y, Z, zdir='z', offset=-100, cmap=cm.coolwarm)
ax.contour(X, Y, Z, zdir='x', offset=-40, cmap=cm.coolwarm)
ax.contour(X, Y, Z, zdir='y', offset=40, cmap=cm.coolwarm)

ax.set(xlim=(-40, 40), ylim=(-40, 40), zlim=(-100, 100),
       xlabel='X', ylabel='Y', zlabel='Z')

plt.show()