Nota
Haga clic aquí para descargar el código de ejemplo completo
Lista de colores con nombre #
Esto traza una lista de los colores con nombre admitidos en matplotlib. Para obtener más información sobre los colores en matplotlib, consulte
el tutorial Especificación de colores ;
la
matplotlib.colorsAPI;
Función de ayuda para trazar #
Primero definimos una función de ayuda para hacer una tabla de colores, luego la usamos en algunas categorías de colores comunes.
from matplotlib.patches import Rectangle
import matplotlib.pyplot as plt
import matplotlib.colors as mcolors


def plot_colortable(colors, sort_colors=True, emptycols=0):

    cell_width = 212
    cell_height = 22
    swatch_width = 48
    margin = 12

    # Sort colors by hue, saturation, value and name.
    if sort_colors is True:
        by_hsv = sorted((tuple(mcolors.rgb_to_hsv(mcolors.to_rgb(color))),
                         name)
                        for name, color in colors.items())
        names = [name for hsv, name in by_hsv]
    else:
        names = list(colors)

    n = len(names)
    ncols = 4 - emptycols
    nrows = n // ncols + int(n % ncols > 0)

    width = cell_width * 4 + 2 * margin
    height = cell_height * nrows + 2 * margin
    dpi = 72

    fig, ax = plt.subplots(figsize=(width / dpi, height / dpi), dpi=dpi)
    fig.subplots_adjust(margin/width, margin/height,
                        (width-margin)/width, (height-margin)/height)
    ax.set_xlim(0, cell_width * 4)
    ax.set_ylim(cell_height * (nrows-0.5), -cell_height/2.)
    ax.yaxis.set_visible(False)
    ax.xaxis.set_visible(False)
    ax.set_axis_off()

    for i, name in enumerate(names):
        row = i % nrows
        col = i // nrows
        y = row * cell_height

        swatch_start_x = cell_width * col
        text_pos_x = cell_width * col + swatch_width + 7

        ax.text(text_pos_x, y, name, fontsize=14,
                horizontalalignment='left',
                verticalalignment='center')

        ax.add_patch(
            Rectangle(xy=(swatch_start_x, y-9), width=swatch_width,
                      height=18, facecolor=colors[name], edgecolor='0.7')
        )

    return fig
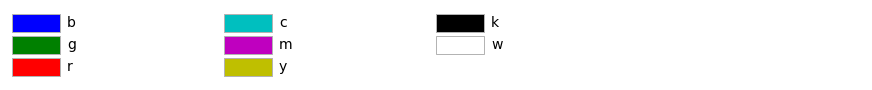
Colores base #
plot_colortable(mcolors.BASE_COLORS, sort_colors=False, emptycols=1)
<Figure size 872x90 with 1 Axes>
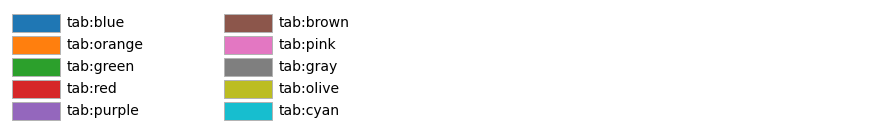
Paleta de Tableau #
plot_colortable(mcolors.TABLEAU_COLORS, sort_colors=False, emptycols=2)
<Figure size 872x134 with 1 Axes>
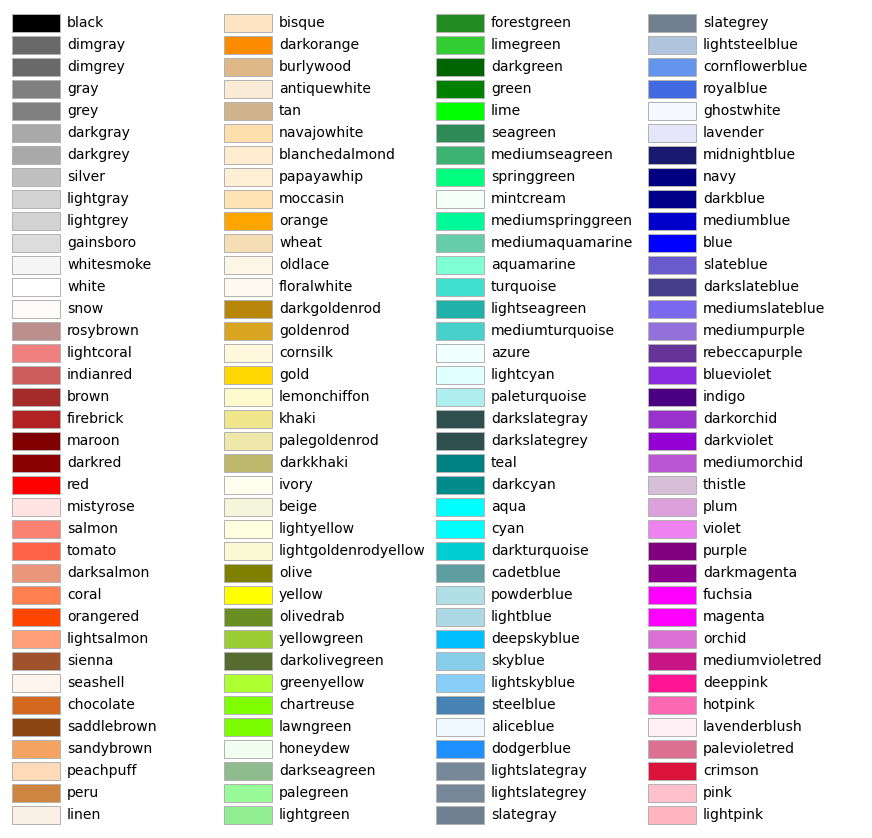
Colores CSS #
plot_colortable(mcolors.CSS4_COLORS)
plt.show()
Colores XKCD #
Se admiten los colores XKCD, pero producen una figura grande, por lo que los omitiremos por ahora. Puede utilizar el siguiente código si lo desea:
xkcd_fig = plot_colortable(mcolors.XKCD_COLORS, "XKCD Colors")
xkcd_fig.savefig("XKCD_Colors.png")
Referencias
En este ejemplo se muestra el uso de las siguientes funciones, métodos, clases y módulos:
Tiempo total de ejecución del script: (0 minutos 1.530 segundos)