Nota
Haga clic aquí para descargar el código de ejemplo completo
El formateador de ticks predeterminado #
El ejemplo muestra el uso del valor predeterminado ScalarFormattercon diferentes configuraciones.
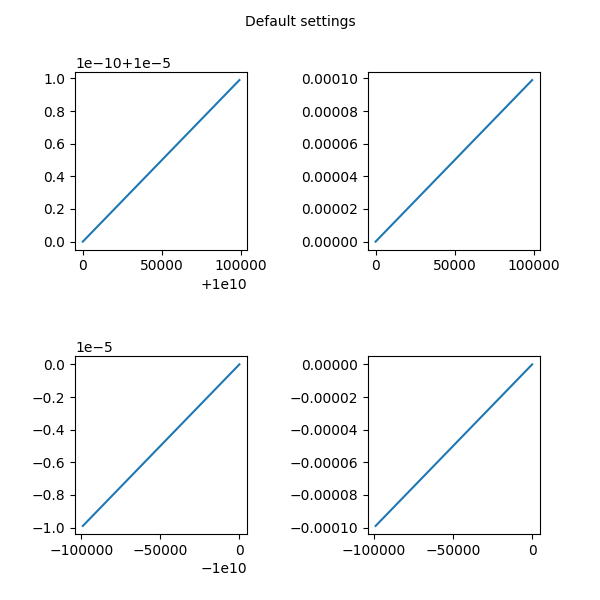
Ejemplo 1: Predeterminado
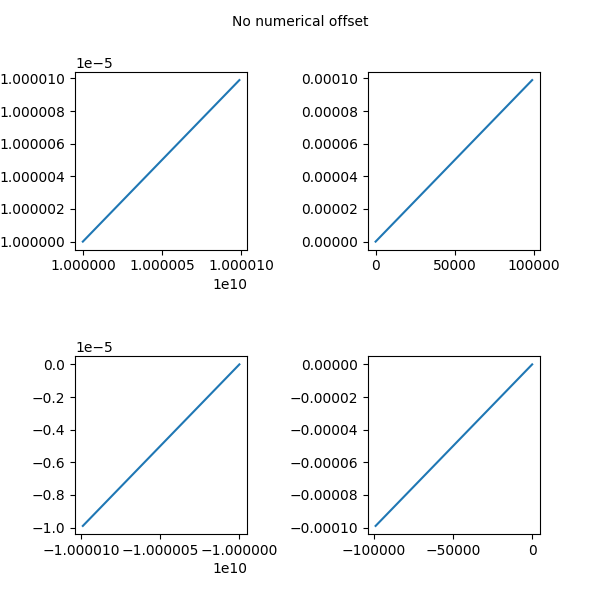
Ejemplo 2: sin compensación numérica
Ejemplo 3: Con Mathtext
import matplotlib.pyplot as plt
import numpy as np
Ejemplo 1
x = np.arange(0, 1, .01)
fig, [[ax1, ax2], [ax3, ax4]] = plt.subplots(2, 2, figsize=(6, 6))
fig.text(0.5, 0.975, 'Default settings',
         horizontalalignment='center',
         verticalalignment='top')

ax1.plot(x * 1e5 + 1e10, x * 1e-10 + 1e-5)

ax2.plot(x * 1e5, x * 1e-4)

ax3.plot(-x * 1e5 - 1e10, -x * 1e-5 - 1e-10)

ax4.plot(-x * 1e5, -x * 1e-4)

fig.subplots_adjust(wspace=0.7, hspace=0.6)
Ejemplo 2
x = np.arange(0, 1, .01)
fig, [[ax1, ax2], [ax3, ax4]] = plt.subplots(2, 2, figsize=(6, 6))
fig.text(0.5, 0.975, 'No numerical offset',
         horizontalalignment='center',
         verticalalignment='top')

ax1.plot(x * 1e5 + 1e10, x * 1e-10 + 1e-5)
ax1.ticklabel_format(useOffset=False)

ax2.plot(x * 1e5, x * 1e-4)
ax2.ticklabel_format(useOffset=False)

ax3.plot(-x * 1e5 - 1e10, -x * 1e-5 - 1e-10)
ax3.ticklabel_format(useOffset=False)

ax4.plot(-x * 1e5, -x * 1e-4)
ax4.ticklabel_format(useOffset=False)

fig.subplots_adjust(wspace=0.7, hspace=0.6)
Ejemplo 3
x = np.arange(0, 1, .01)
fig, [[ax1, ax2], [ax3, ax4]] = plt.subplots(2, 2, figsize=(6, 6))
fig.text(0.5, 0.975, 'With mathtext',
         horizontalalignment='center',
         verticalalignment='top')

ax1.plot(x * 1e5 + 1e10, x * 1e-10 + 1e-5)
ax1.ticklabel_format(useMathText=True)

ax2.plot(x * 1e5, x * 1e-4)
ax2.ticklabel_format(useMathText=True)

ax3.plot(-x * 1e5 - 1e10, -x * 1e-5 - 1e-10)
ax3.ticklabel_format(useMathText=True)

ax4.plot(-x * 1e5, -x * 1e-4)
ax4.ticklabel_format(useMathText=True)

fig.subplots_adjust(wspace=0.7, hspace=0.6)

plt.show()

Tiempo total de ejecución del script: (0 minutos 1,866 segundos)