Nota
Haga clic aquí para descargar el código de ejemplo completo
Ejes con un tamaño físico fijo #
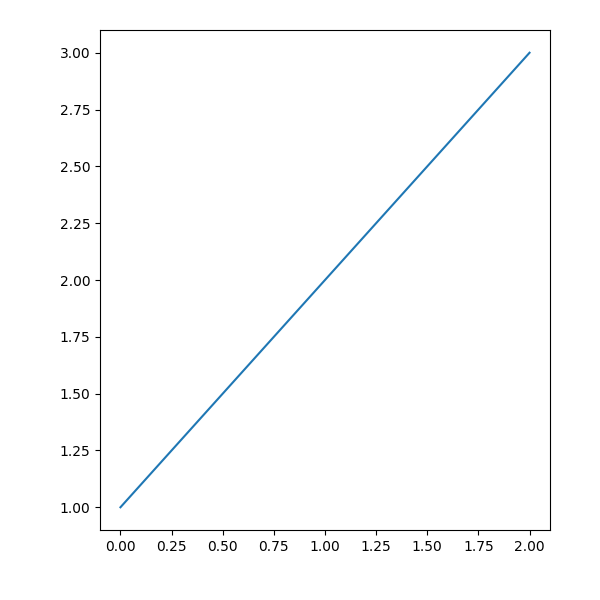
import matplotlib.pyplot as plt

from mpl_toolkits.axes_grid1 import Divider, Size
fig = plt.figure(figsize=(6, 6))

# The first items are for padding and the second items are for the axes.
# sizes are in inch.
h = [Size.Fixed(1.0), Size.Fixed(4.5)]
v = [Size.Fixed(0.7), Size.Fixed(5.)]

divider = Divider(fig, (0, 0, 1, 1), h, v, aspect=False)
# The width and height of the rectangle are ignored.

ax = fig.add_axes(divider.get_position(),
                  axes_locator=divider.new_locator(nx=1, ny=1))

ax.plot([1, 2, 3])

[<matplotlib.lines.Line2D object at 0x7f2cdd49e4a0>]
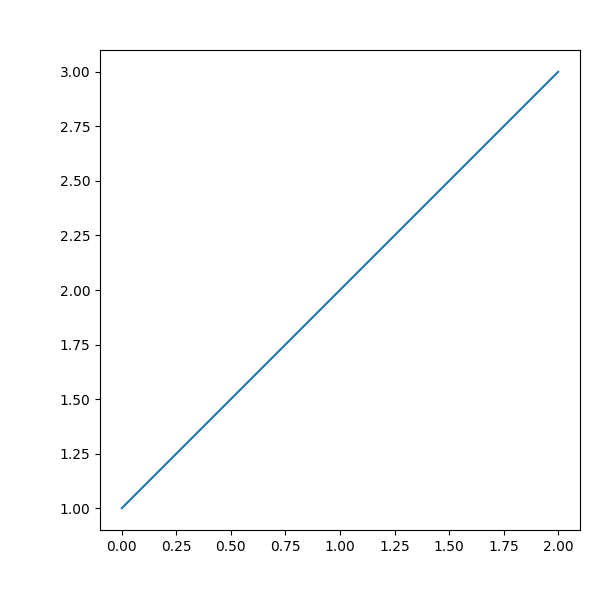
fig = plt.figure(figsize=(6, 6))

# The first & third items are for padding and the second items are for the
# axes. Sizes are in inches.
h = [Size.Fixed(1.0), Size.Scaled(1.), Size.Fixed(.2)]
v = [Size.Fixed(0.7), Size.Scaled(1.), Size.Fixed(.5)]

divider = Divider(fig, (0, 0, 1, 1), h, v, aspect=False)
# The width and height of the rectangle are ignored.

ax = fig.add_axes(divider.get_position(),
                  axes_locator=divider.new_locator(nx=1, ny=1))

ax.plot([1, 2, 3])

plt.show()
