Nota
Haga clic aquí para descargar el código de ejemplo completo
Número de referencia del mapa de colores
Referencia para mapas de colores incluidos con Matplotlib.
Una versión invertida de cada uno de estos mapas de colores está disponible agregando
_ral nombre, por ejemplo, viridis_r.
Consulte Elegir mapas de colores en Matplotlib para obtener una discusión detallada sobre los mapas de colores, incluida la compatibilidad con daltónicos.
import numpy as np
import matplotlib.pyplot as plt
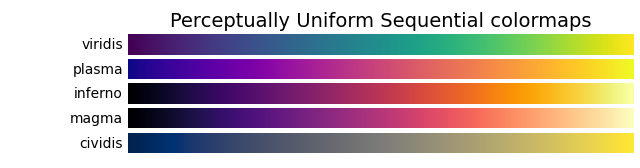
cmaps = [('Perceptually Uniform Sequential', [
'viridis', 'plasma', 'inferno', 'magma', 'cividis']),
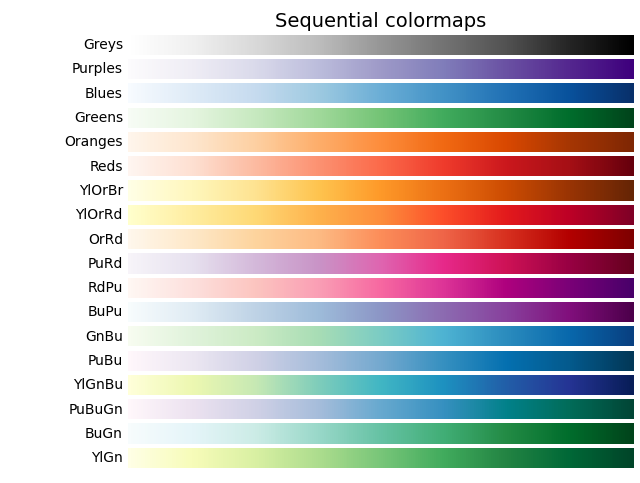
('Sequential', [
'Greys', 'Purples', 'Blues', 'Greens', 'Oranges', 'Reds',
'YlOrBr', 'YlOrRd', 'OrRd', 'PuRd', 'RdPu', 'BuPu',
'GnBu', 'PuBu', 'YlGnBu', 'PuBuGn', 'BuGn', 'YlGn']),
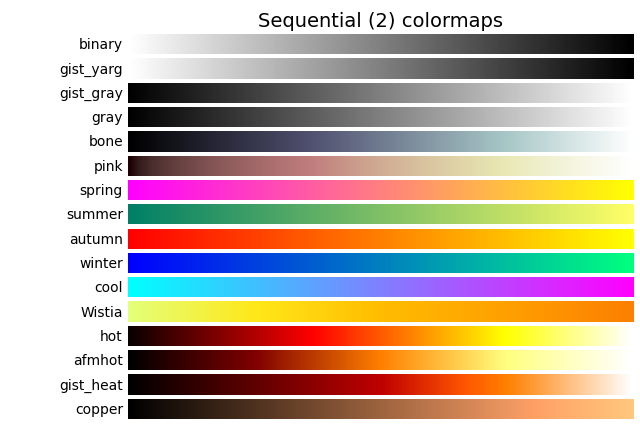
('Sequential (2)', [
'binary', 'gist_yarg', 'gist_gray', 'gray', 'bone', 'pink',
'spring', 'summer', 'autumn', 'winter', 'cool', 'Wistia',
'hot', 'afmhot', 'gist_heat', 'copper']),
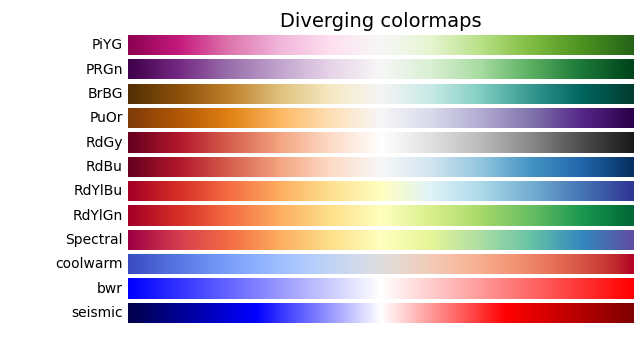
('Diverging', [
'PiYG', 'PRGn', 'BrBG', 'PuOr', 'RdGy', 'RdBu',
'RdYlBu', 'RdYlGn', 'Spectral', 'coolwarm', 'bwr', 'seismic']),
('Cyclic', ['twilight', 'twilight_shifted', 'hsv']),
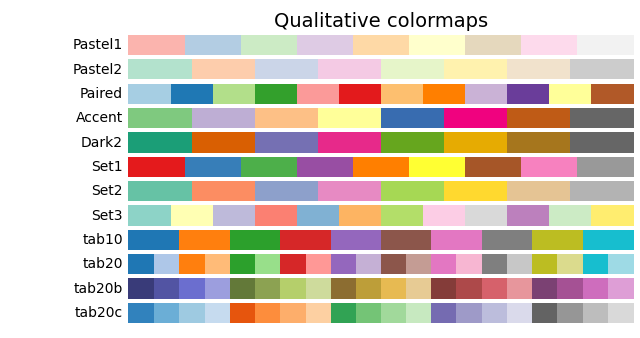
('Qualitative', [
'Pastel1', 'Pastel2', 'Paired', 'Accent',
'Dark2', 'Set1', 'Set2', 'Set3',
'tab10', 'tab20', 'tab20b', 'tab20c']),
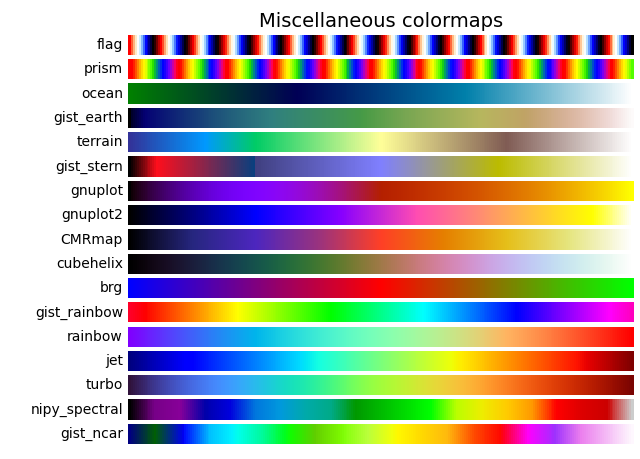
('Miscellaneous', [
'flag', 'prism', 'ocean', 'gist_earth', 'terrain', 'gist_stern',
'gnuplot', 'gnuplot2', 'CMRmap', 'cubehelix', 'brg',
'gist_rainbow', 'rainbow', 'jet', 'turbo', 'nipy_spectral',
'gist_ncar'])]
gradient = np.linspace(0, 1, 256)
gradient = np.vstack((gradient, gradient))
def plot_color_gradients(cmap_category, cmap_list):
# Create figure and adjust figure height to number of colormaps
nrows = len(cmap_list)
figh = 0.35 + 0.15 + (nrows + (nrows-1)*0.1)*0.22
fig, axs = plt.subplots(nrows=nrows, figsize=(6.4, figh))
fig.subplots_adjust(top=1-.35/figh, bottom=.15/figh, left=0.2, right=0.99)
axs[0].set_title(cmap_category + ' colormaps', fontsize=14)
for ax, cmap_name in zip(axs, cmap_list):
ax.imshow(gradient, aspect='auto', cmap=cmap_name)
ax.text(-.01, .5, cmap_name, va='center', ha='right', fontsize=10,
transform=ax.transAxes)
# Turn off *all* ticks & spines, not just the ones with colormaps.
for ax in axs:
ax.set_axis_off()
for cmap_category, cmap_list in cmaps:
plot_color_gradients(cmap_category, cmap_list)
plt.show()

Referencias
En este ejemplo se muestra el uso de las siguientes funciones, métodos, clases y módulos:
Tiempo total de ejecución del script: (0 minutos 2.854 segundos)