Nota
Haga clic aquí para descargar el código de ejemplo completo
Especificaciones de cuadrícula anidadas #
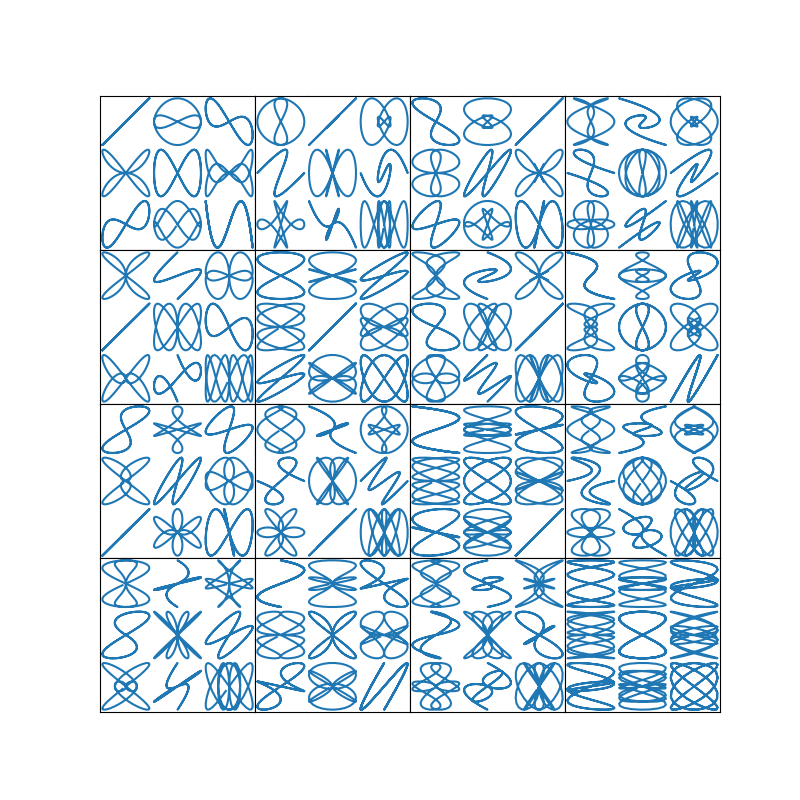
Este ejemplo demuestra el uso de s anidados GridSpec.

import matplotlib.pyplot as plt
import numpy as np


def squiggle_xy(a, b, c, d):
    i = np.arange(0.0, 2*np.pi, 0.05)
    return np.sin(i*a)*np.cos(i*b), np.sin(i*c)*np.cos(i*d)


fig = plt.figure(figsize=(8, 8))
outer_grid = fig.add_gridspec(4, 4, wspace=0, hspace=0)

for a in range(4):
    for b in range(4):
        # gridspec inside gridspec
        inner_grid = outer_grid[a, b].subgridspec(3, 3, wspace=0, hspace=0)
        axs = inner_grid.subplots()  # Create all subplots for the inner grid.
        for (c, d), ax in np.ndenumerate(axs):
            ax.plot(*squiggle_xy(a + 1, b + 1, c + 1, d + 1))
            ax.set(xticks=[], yticks=[])

# show only the outside spines
for ax in fig.get_axes():
    ss = ax.get_subplotspec()
    ax.spines.top.set_visible(ss.is_first_row())
    ax.spines.bottom.set_visible(ss.is_last_row())
    ax.spines.left.set_visible(ss.is_first_col())
    ax.spines.right.set_visible(ss.is_last_col())

plt.show()
Tiempo total de ejecución del script: (0 minutos 3.296 segundos)