Nota
Haga clic aquí para descargar el código de ejemplo completo
Prueba de Evans #
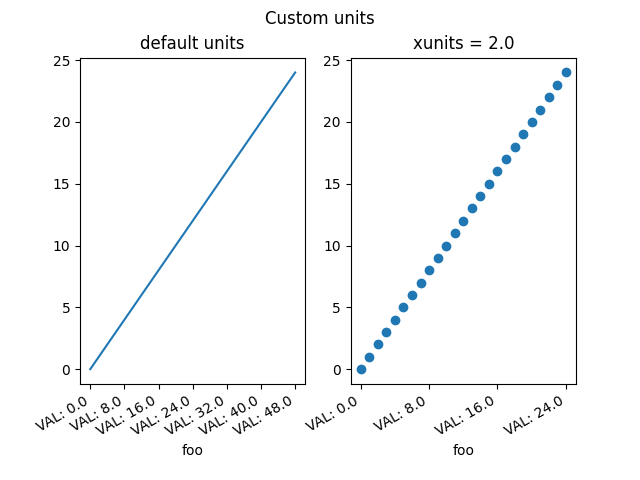
Una clase de unidades "Foo" de maqueta que admite la conversión y diferentes formatos de ticks según la "unidad". Aquí, la "unidad" es solo un factor de conversión escalar, pero este ejemplo muestra que Matplotlib es completamente independiente del tipo de unidades que usan los paquetes de clientes.

import numpy as np

import matplotlib.units as units
import matplotlib.ticker as ticker
import matplotlib.pyplot as plt


class Foo:
    def __init__(self, val, unit=1.0):
        self.unit = unit
        self._val = val * unit

    def value(self, unit):
        if unit is None:
            unit = self.unit
        return self._val / unit


class FooConverter(units.ConversionInterface):
    @staticmethod
    def axisinfo(unit, axis):
        """Return the Foo AxisInfo."""
        if unit == 1.0 or unit == 2.0:
            return units.AxisInfo(
                majloc=ticker.IndexLocator(8, 0),
                majfmt=ticker.FormatStrFormatter("VAL: %s"),
                label='foo',
                )

        else:
            return None

    @staticmethod
    def convert(obj, unit, axis):
        """
        Convert *obj* using *unit*.

        If *obj* is a sequence, return the converted sequence.
        """
        if np.iterable(obj):
            return [o.value(unit) for o in obj]
        else:
            return obj.value(unit)

    @staticmethod
    def default_units(x, axis):
        """Return the default unit for *x* or None."""
        if np.iterable(x):
            for thisx in x:
                return thisx.unit
        else:
            return x.unit


units.registry[Foo] = FooConverter()

# create some Foos
x = [Foo(val, 1.0) for val in range(0, 50, 2)]
# and some arbitrary y data
y = [i for i in range(len(x))]

fig, (ax1, ax2) = plt.subplots(1, 2)
fig.suptitle("Custom units")
fig.subplots_adjust(bottom=0.2)

# plot specifying units
ax2.plot(x, y, 'o', xunits=2.0)
ax2.set_title("xunits = 2.0")
plt.setp(ax2.get_xticklabels(), rotation=30, ha='right')

# plot without specifying units; will use the None branch for axisinfo
ax1.plot(x, y)  # uses default units
ax1.set_title('default units')
plt.setp(ax1.get_xticklabels(), rotation=30, ha='right')

plt.show()