Nota
Haga clic aquí para descargar el código de ejemplo completo
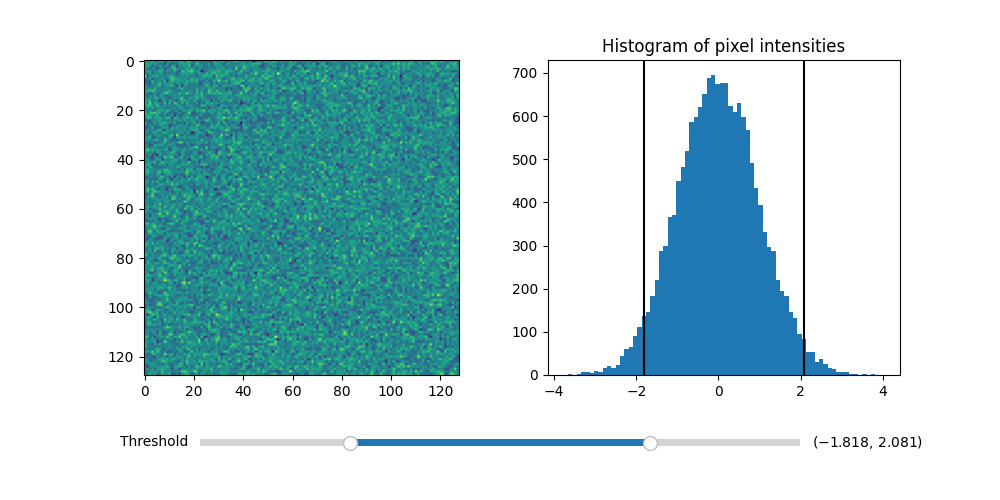
Umbral de una imagen con RangeSlider #
Uso del widget RangeSlider para controlar el umbral de una imagen.
El widget RangeSlider se puede usar de manera similar al widgets.Slider
widget. La principal diferencia es que el atributo de RangeSlider vales una tupla de flotadores en lugar de un solo flotador.(lower val, upper val)
Consulte Control deslizante para ver un ejemplo del uso de a Sliderpara controlar un solo flotador.
Consulte Ajuste de controles deslizantes a valores discretos para ver un ejemplo de Sliderajuste a valores discretos.
import numpy as np
import matplotlib.pyplot as plt
from matplotlib.widgets import RangeSlider

# generate a fake image
np.random.seed(19680801)
N = 128
img = np.random.randn(N, N)

fig, axs = plt.subplots(1, 2, figsize=(10, 5))
fig.subplots_adjust(bottom=0.25)

im = axs[0].imshow(img)
axs[1].hist(img.flatten(), bins='auto')
axs[1].set_title('Histogram of pixel intensities')

# Create the RangeSlider
slider_ax = fig.add_axes([0.20, 0.1, 0.60, 0.03])
slider = RangeSlider(slider_ax, "Threshold", img.min(), img.max())

# Create the Vertical lines on the histogram
lower_limit_line = axs[1].axvline(slider.val[0], color='k')
upper_limit_line = axs[1].axvline(slider.val[1], color='k')


def update(val):
    # The val passed to a callback by the RangeSlider will
    # be a tuple of (min, max)

    # Update the image's colormap
    im.norm.vmin = val[0]
    im.norm.vmax = val[1]

    # Update the position of the vertical lines
    lower_limit_line.set_xdata([val[0], val[0]])
    upper_limit_line.set_xdata([val[1], val[1]])

    # Redraw the figure to ensure it updates
    fig.canvas.draw_idle()


slider.on_changed(update)
plt.show()
Referencias
En este ejemplo se muestra el uso de las siguientes funciones, métodos, clases y módulos: