Nota
Haga clic aquí para descargar el código de ejemplo completo
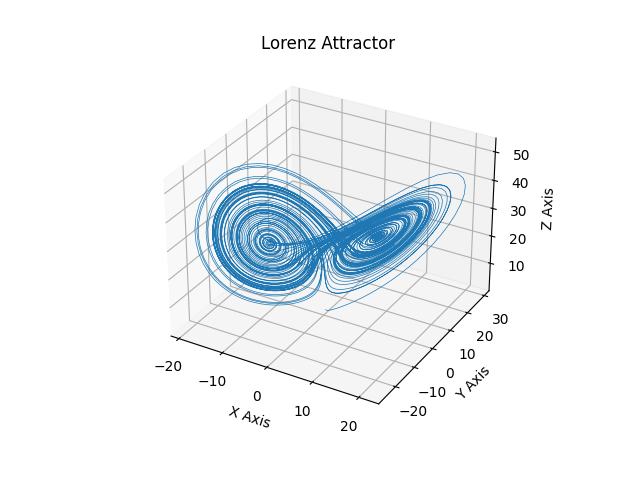
Atractor de Lorenz #
Este es un ejemplo del trazado del "Flujo no periódico determinista" de Edward Lorenz de 1963 en un espacio tridimensional usando mplot3d.
Nota
Debido a que se trata de una ODE no lineal simple, se haría más fácilmente con el solucionador de ODE de SciPy, pero este enfoque depende solo de NumPy.
import numpy as np
import matplotlib.pyplot as plt


def lorenz(xyz, *, s=10, r=28, b=2.667):
    """
    Parameters
    ----------
    xyz : array-like, shape (3,)
       Point of interest in three dimensional space.
    s, r, b : float
       Parameters defining the Lorenz attractor.

    Returns
    -------
    xyz_dot : array, shape (3,)
       Values of the Lorenz attractor's partial derivatives at *xyz*.
    """
    x, y, z = xyz
    x_dot = s*(y - x)
    y_dot = r*x - y - x*z
    z_dot = x*y - b*z
    return np.array([x_dot, y_dot, z_dot])


dt = 0.01
num_steps = 10000

xyzs = np.empty((num_steps + 1, 3))  # Need one more for the initial values
xyzs[0] = (0., 1., 1.05)  # Set initial values
# Step through "time", calculating the partial derivatives at the current point
# and using them to estimate the next point
for i in range(num_steps):
    xyzs[i + 1] = xyzs[i] + lorenz(xyzs[i]) * dt

# Plot
ax = plt.figure().add_subplot(projection='3d')

ax.plot(*xyzs.T, lw=0.5)
ax.set_xlabel("X Axis")
ax.set_ylabel("Y Axis")
ax.set_zlabel("Z Axis")
ax.set_title("Lorenz Attractor")

plt.show()