Nota
Haga clic aquí para descargar el código de ejemplo completo
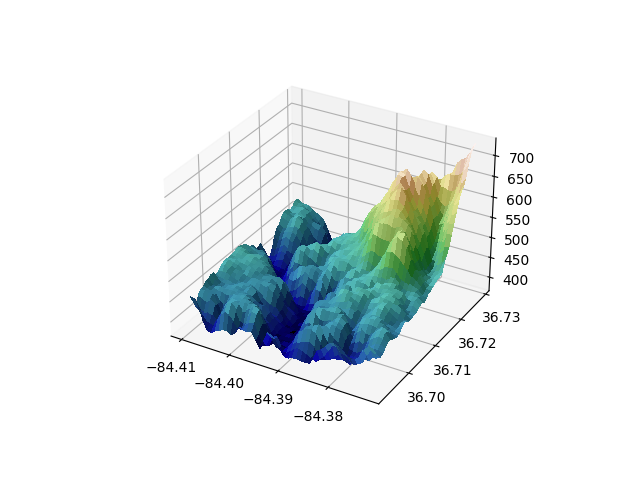
Sombreado personalizado en un gráfico de superficie 3D #
Demuestra el uso de sombreado personalizado en un gráfico de superficie 3D.
from matplotlib import cbook
from matplotlib import cm
from matplotlib.colors import LightSource
import matplotlib.pyplot as plt
import numpy as np

# Load and format data
dem = cbook.get_sample_data('jacksboro_fault_dem.npz', np_load=True)
z = dem['elevation']
nrows, ncols = z.shape
x = np.linspace(dem['xmin'], dem['xmax'], ncols)
y = np.linspace(dem['ymin'], dem['ymax'], nrows)
x, y = np.meshgrid(x, y)

region = np.s_[5:50, 5:50]
x, y, z = x[region], y[region], z[region]

# Set up plot
fig, ax = plt.subplots(subplot_kw=dict(projection='3d'))

ls = LightSource(270, 45)
# To use a custom hillshading mode, override the built-in shading and pass
# in the rgb colors of the shaded surface calculated from "shade".
rgb = ls.shade(z, cmap=cm.gist_earth, vert_exag=0.1, blend_mode='soft')
surf = ax.plot_surface(x, y, z, rstride=1, cstride=1, facecolors=rgb,
                       linewidth=0, antialiased=False, shade=False)

plt.show()