Nota
Haga clic aquí para descargar el código de ejemplo completo
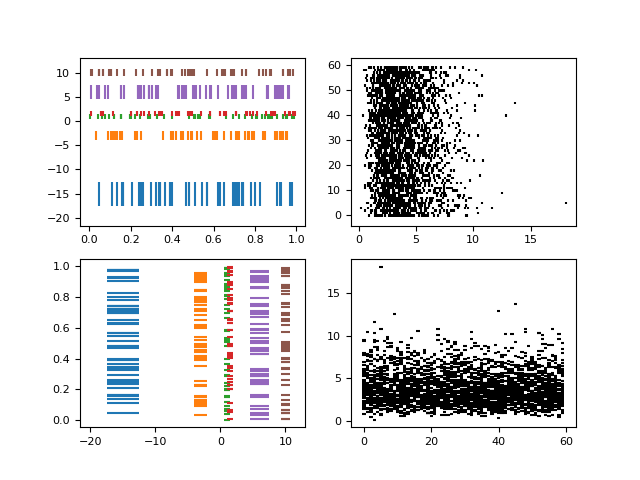
Eventplot Demostración #
Un diagrama de eventos que muestra secuencias de eventos con varias propiedades de línea. El gráfico se muestra tanto en orientación horizontal como vertical.
import matplotlib.pyplot as plt
import numpy as np
import matplotlib
matplotlib.rcParams['font.size'] = 8.0

# Fixing random state for reproducibility
np.random.seed(19680801)


# create random data
data1 = np.random.random([6, 50])

# set different colors for each set of positions
colors1 = ['C{}'.format(i) for i in range(6)]

# set different line properties for each set of positions
# note that some overlap
lineoffsets1 = [-15, -3, 1, 1.5, 6, 10]
linelengths1 = [5, 2, 1, 1, 3, 1.5]

fig, axs = plt.subplots(2, 2)

# create a horizontal plot
axs[0, 0].eventplot(data1, colors=colors1, lineoffsets=lineoffsets1,
                    linelengths=linelengths1)

# create a vertical plot
axs[1, 0].eventplot(data1, colors=colors1, lineoffsets=lineoffsets1,
                    linelengths=linelengths1, orientation='vertical')

# create another set of random data.
# the gamma distribution is only used for aesthetic purposes
data2 = np.random.gamma(4, size=[60, 50])

# use individual values for the parameters this time
# these values will be used for all data sets (except lineoffsets2, which
# sets the increment between each data set in this usage)
colors2 = 'black'
lineoffsets2 = 1
linelengths2 = 1

# create a horizontal plot
axs[0, 1].eventplot(data2, colors=colors2, lineoffsets=lineoffsets2,
                    linelengths=linelengths2)


# create a vertical plot
axs[1, 1].eventplot(data2, colors=colors2, lineoffsets=lineoffsets2,
                    linelengths=linelengths2, orientation='vertical')

plt.show()