Nota
Haga clic aquí para descargar el código de ejemplo completo
Representación de ecuaciones matemáticas usando TeX #
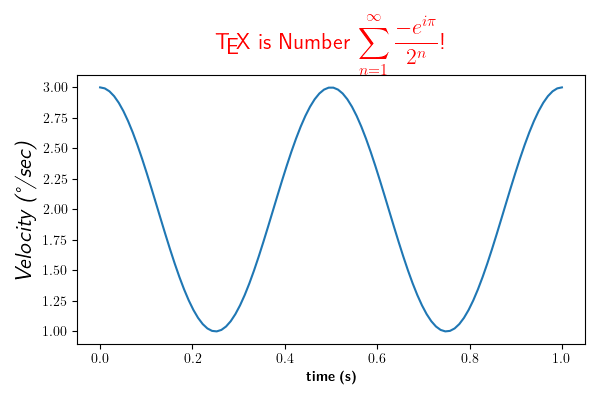
Puede usar TeX para representar todo el texto de Matplotlib configurando
rcParams["text.usetex"](predeterminado: False) en True. Esto requiere que tengas TeX y las otras dependencias descritas en el tutorial de Representación de texto con LaTeX correctamente instaladas en tu sistema. Matplotlib almacena en caché las expresiones TeX procesadas, de modo que solo la primera aparición de una expresión desencadena una compilación TeX. Las ocurrencias posteriores reutilizan la imagen renderizada del caché y, por lo tanto, son más rápidas.
Se admite la entrada Unicode, por ejemplo, para la etiqueta del eje y en este ejemplo.
import numpy as np
import matplotlib.pyplot as plt

plt.rcParams['text.usetex'] = True


t = np.linspace(0.0, 1.0, 100)
s = np.cos(4 * np.pi * t) + 2

fig, ax = plt.subplots(figsize=(6, 4), tight_layout=True)
ax.plot(t, s)

ax.set_xlabel(r'\textbf{time (s)}')
ax.set_ylabel('\\textit{Velocity (\N{DEGREE SIGN}/sec)}', fontsize=16)
ax.set_title(r'\TeX\ is Number $\displaystyle\sum_{n=1}^\infty'
             r'\frac{-e^{i\pi}}{2^n}$!', fontsize=16, color='r')

Text(0.5, 1.0652809399537557, '\\TeX\\ is Number $\\displaystyle\\sum_{n=1}^\\infty\\frac{-e^{i\\pi}}{2^n}$!')
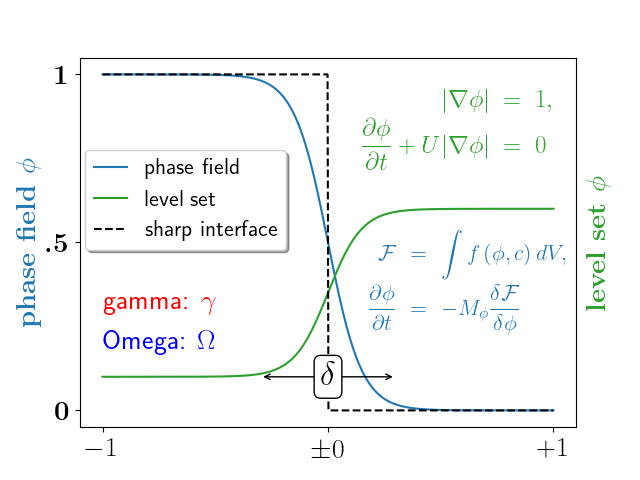
Un ejemplo más complejo.
fig, ax = plt.subplots()
# interface tracking profiles
N = 500
delta = 0.6
X = np.linspace(-1, 1, N)
ax.plot(X, (1 - np.tanh(4 * X / delta)) / 2,    # phase field tanh profiles
        X, (1.4 + np.tanh(4 * X / delta)) / 4, "C2",  # composition profile
        X, X < 0, "k--")                        # sharp interface

# legend
ax.legend(("phase field", "level set", "sharp interface"),
          shadow=True, loc=(0.01, 0.48), handlelength=1.5, fontsize=16)

# the arrow
ax.annotate("", xy=(-delta / 2., 0.1), xytext=(delta / 2., 0.1),
            arrowprops=dict(arrowstyle="<->", connectionstyle="arc3"))
ax.text(0, 0.1, r"$\delta$",
        color="black", fontsize=24,
        horizontalalignment="center", verticalalignment="center",
        bbox=dict(boxstyle="round", fc="white", ec="black", pad=0.2))

# Use tex in labels
ax.set_xticks([-1, 0, 1])
ax.set_xticklabels(["$-1$", r"$\pm 0$", "$+1$"], color="k", size=20)

# Left Y-axis labels, combine math mode and text mode
ax.set_ylabel(r"\bf{phase field} $\phi$", color="C0", fontsize=20)
ax.set_yticks([0, 0.5, 1])
ax.set_yticklabels([r"\bf{0}", r"\bf{.5}", r"\bf{1}"], color="k", size=20)

# Right Y-axis labels
ax.text(1.02, 0.5, r"\bf{level set} $\phi$",
        color="C2", fontsize=20, rotation=90,
        horizontalalignment="left", verticalalignment="center",
        clip_on=False, transform=ax.transAxes)

# Use multiline environment inside a `text`.
# level set equations
eq1 = (r"\begin{eqnarray*}"
       r"|\nabla\phi| &=& 1,\\"
       r"\frac{\partial \phi}{\partial t} + U|\nabla \phi| &=& 0 "
       r"\end{eqnarray*}")
ax.text(1, 0.9, eq1, color="C2", fontsize=18,
        horizontalalignment="right", verticalalignment="top")

# phase field equations
eq2 = (r"\begin{eqnarray*}"
       r"\mathcal{F} &=& \int f\left( \phi, c \right) dV, \\ "
       r"\frac{ \partial \phi } { \partial t } &=& -M_{ \phi } "
       r"\frac{ \delta \mathcal{F} } { \delta \phi }"
       r"\end{eqnarray*}")
ax.text(0.18, 0.18, eq2, color="C0", fontsize=16)

ax.text(-1, .30, r"gamma: $\gamma$", color="r", fontsize=20)
ax.text(-1, .18, r"Omega: $\Omega$", color="b", fontsize=20)

plt.show()

Tiempo total de ejecución del script: (0 minutos 1.076 segundos)