Nota
Haga clic aquí para descargar el código de ejemplo completo
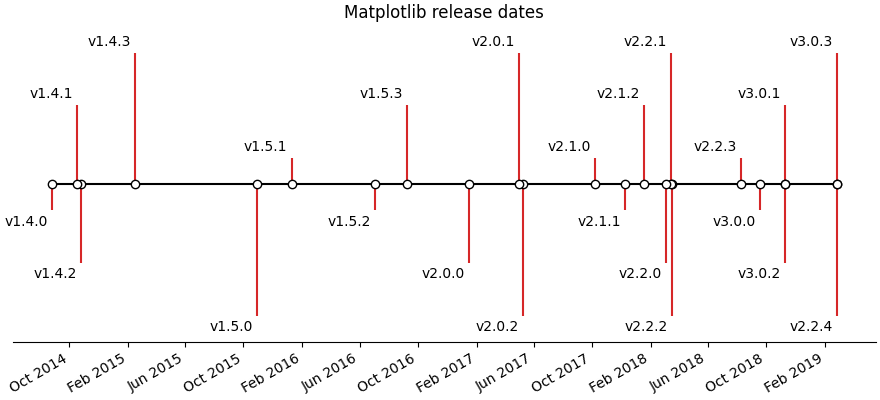
Creación de una línea de tiempo con líneas, fechas y texto #
Cómo crear una línea de tiempo simple usando las fechas de lanzamiento de Matplotlib.
Las líneas de tiempo se pueden crear con una colección de fechas y texto. En este ejemplo, mostramos cómo crear una línea de tiempo simple usando las fechas de los lanzamientos recientes de Matplotlib. Primero, extraeremos los datos de GitHub.
import matplotlib.pyplot as plt
import numpy as np
import matplotlib.dates as mdates
from datetime import datetime

try:
    # Try to fetch a list of Matplotlib releases and their dates
    # from https://api.github.com/repos/matplotlib/matplotlib/releases
    import urllib.request
    import json

    url = 'https://api.github.com/repos/matplotlib/matplotlib/releases'
    url += '?per_page=100'
    data = json.loads(urllib.request.urlopen(url, timeout=.4).read().decode())

    dates = []
    names = []
    for item in data:
        if 'rc' not in item['tag_name'] and 'b' not in item['tag_name']:
            dates.append(item['published_at'].split("T")[0])
            names.append(item['tag_name'])
    # Convert date strings (e.g. 2014-10-18) to datetime
    dates = [datetime.strptime(d, "%Y-%m-%d") for d in dates]

except Exception:
    # In case the above fails, e.g. because of missing internet connection
    # use the following lists as fallback.
    names = ['v2.2.4', 'v3.0.3', 'v3.0.2', 'v3.0.1', 'v3.0.0', 'v2.2.3',
             'v2.2.2', 'v2.2.1', 'v2.2.0', 'v2.1.2', 'v2.1.1', 'v2.1.0',
             'v2.0.2', 'v2.0.1', 'v2.0.0', 'v1.5.3', 'v1.5.2', 'v1.5.1',
             'v1.5.0', 'v1.4.3', 'v1.4.2', 'v1.4.1', 'v1.4.0']

    dates = ['2019-02-26', '2019-02-26', '2018-11-10', '2018-11-10',
             '2018-09-18', '2018-08-10', '2018-03-17', '2018-03-16',
             '2018-03-06', '2018-01-18', '2017-12-10', '2017-10-07',
             '2017-05-10', '2017-05-02', '2017-01-17', '2016-09-09',
             '2016-07-03', '2016-01-10', '2015-10-29', '2015-02-16',
             '2014-10-26', '2014-10-18', '2014-08-26']

    # Convert date strings (e.g. 2014-10-18) to datetime
    dates = [datetime.strptime(d, "%Y-%m-%d") for d in dates]
A continuación, crearemos un diagrama de tallo con alguna variación en los niveles para distinguir incluso los eventos cercanos. Agregamos marcadores en la línea de base para enfatizar visualmente la naturaleza unidimensional de la línea de tiempo.
Para cada evento, agregamos una etiqueta de texto a través annotatede , que se compensa en unidades de puntos desde la punta de la línea del evento.
Tenga en cuenta que Matplotlib trazará automáticamente las entradas de fecha y hora.
# Choose some nice levels
levels = np.tile([-5, 5, -3, 3, -1, 1],
                 int(np.ceil(len(dates)/6)))[:len(dates)]

# Create figure and plot a stem plot with the date
fig, ax = plt.subplots(figsize=(8.8, 4), constrained_layout=True)
ax.set(title="Matplotlib release dates")

ax.vlines(dates, 0, levels, color="tab:red")  # The vertical stems.
ax.plot(dates, np.zeros_like(dates), "-o",
        color="k", markerfacecolor="w")  # Baseline and markers on it.

# annotate lines
for d, l, r in zip(dates, levels, names):
    ax.annotate(r, xy=(d, l),
                xytext=(-3, np.sign(l)*3), textcoords="offset points",
                horizontalalignment="right",
                verticalalignment="bottom" if l > 0 else "top")

# format xaxis with 4 month intervals
ax.xaxis.set_major_locator(mdates.MonthLocator(interval=4))
ax.xaxis.set_major_formatter(mdates.DateFormatter("%b %Y"))
plt.setp(ax.get_xticklabels(), rotation=30, ha="right")

# remove y axis and spines
ax.yaxis.set_visible(False)
ax.spines[["left", "top", "right"]].set_visible(False)

ax.margins(y=0.1)
plt.show()
Referencias
En este ejemplo se muestra el uso de las siguientes funciones, métodos, clases y módulos:
Tiempo total de ejecución del script: (0 minutos 1,168 segundos)