Nota
Haga clic aquí para descargar el código de ejemplo completo
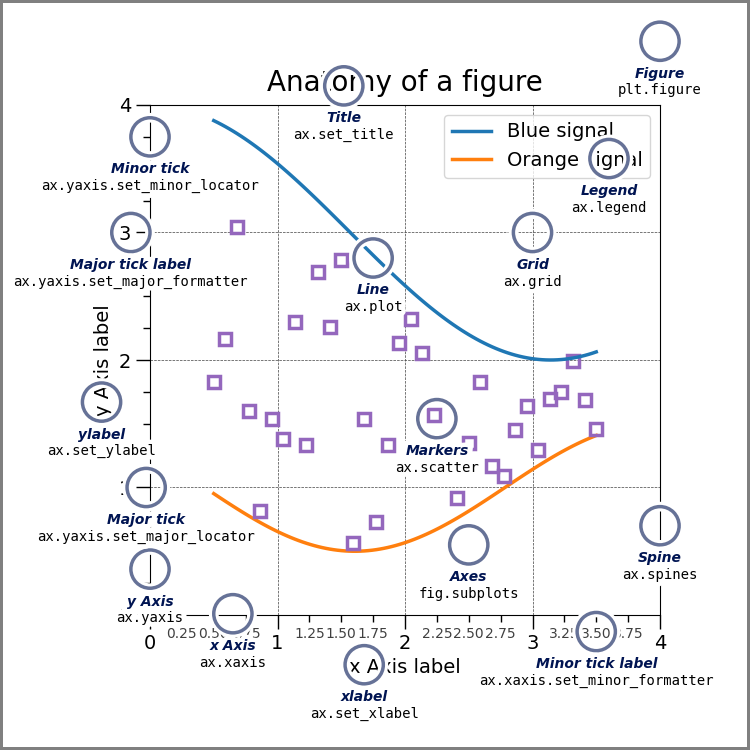
Anatomía de una figura #
Esta figura muestra el nombre de varios elementos de matplotlib que componen una figura.
import numpy as np
import matplotlib.pyplot as plt
from matplotlib.patches import Circle
from matplotlib.patheffects import withStroke
from matplotlib.ticker import AutoMinorLocator, MultipleLocator

royal_blue = [0, 20/256, 82/256]


# make the figure

np.random.seed(19680801)

X = np.linspace(0.5, 3.5, 100)
Y1 = 3+np.cos(X)
Y2 = 1+np.cos(1+X/0.75)/2
Y3 = np.random.uniform(Y1, Y2, len(X))

fig = plt.figure(figsize=(7.5, 7.5))
ax = fig.add_axes([0.2, 0.17, 0.68, 0.7], aspect=1)

ax.xaxis.set_major_locator(MultipleLocator(1.000))
ax.xaxis.set_minor_locator(AutoMinorLocator(4))
ax.yaxis.set_major_locator(MultipleLocator(1.000))
ax.yaxis.set_minor_locator(AutoMinorLocator(4))
ax.xaxis.set_minor_formatter("{x:.2f}")

ax.set_xlim(0, 4)
ax.set_ylim(0, 4)

ax.tick_params(which='major', width=1.0, length=10, labelsize=14)
ax.tick_params(which='minor', width=1.0, length=5, labelsize=10,
               labelcolor='0.25')

ax.grid(linestyle="--", linewidth=0.5, color='.25', zorder=-10)

ax.plot(X, Y1, c='C0', lw=2.5, label="Blue signal", zorder=10)
ax.plot(X, Y2, c='C1', lw=2.5, label="Orange signal")
ax.plot(X[::3], Y3[::3], linewidth=0, markersize=9,
        marker='s', markerfacecolor='none', markeredgecolor='C4',
        markeredgewidth=2.5)

ax.set_title("Anatomy of a figure", fontsize=20, verticalalignment='bottom')
ax.set_xlabel("x Axis label", fontsize=14)
ax.set_ylabel("y Axis label", fontsize=14)
ax.legend(loc="upper right", fontsize=14)


# Annotate the figure

def annotate(x, y, text, code):
    # Circle marker
    c = Circle((x, y), radius=0.15, clip_on=False, zorder=10, linewidth=2.5,
               edgecolor=royal_blue + [0.6], facecolor='none',
               path_effects=[withStroke(linewidth=7, foreground='white')])
    ax.add_artist(c)

    # use path_effects as a background for the texts
    # draw the path_effects and the colored text separately so that the
    # path_effects cannot clip other texts
    for path_effects in [[withStroke(linewidth=7, foreground='white')], []]:
        color = 'white' if path_effects else royal_blue
        ax.text(x, y-0.2, text, zorder=100,
                ha='center', va='top', weight='bold', color=color,
                style='italic', fontfamily='Courier New',
                path_effects=path_effects)

        color = 'white' if path_effects else 'black'
        ax.text(x, y-0.33, code, zorder=100,
                ha='center', va='top', weight='normal', color=color,
                fontfamily='monospace', fontsize='medium',
                path_effects=path_effects)


annotate(3.5, -0.13, "Minor tick label", "ax.xaxis.set_minor_formatter")
annotate(-0.03, 1.0, "Major tick", "ax.yaxis.set_major_locator")
annotate(0.00, 3.75, "Minor tick", "ax.yaxis.set_minor_locator")
annotate(-0.15, 3.00, "Major tick label", "ax.yaxis.set_major_formatter")
annotate(1.68, -0.39, "xlabel", "ax.set_xlabel")
annotate(-0.38, 1.67, "ylabel", "ax.set_ylabel")
annotate(1.52, 4.15, "Title", "ax.set_title")
annotate(1.75, 2.80, "Line", "ax.plot")
annotate(2.25, 1.54, "Markers", "ax.scatter")
annotate(3.00, 3.00, "Grid", "ax.grid")
annotate(3.60, 3.58, "Legend", "ax.legend")
annotate(2.5, 0.55, "Axes", "fig.subplots")
annotate(4, 4.5, "Figure", "plt.figure")
annotate(0.65, 0.01, "x Axis", "ax.xaxis")
annotate(0, 0.36, "y Axis", "ax.yaxis")
annotate(4.0, 0.7, "Spine", "ax.spines")

# frame around figure
fig.patch.set(linewidth=4, edgecolor='0.5')
plt.show()
Referencias
En este ejemplo se muestra el uso de las siguientes funciones, métodos, clases y módulos:
Tiempo total de ejecución del script: (0 minutos 2,245 segundos)