Nota
Haga clic aquí para descargar el código de ejemplo completo
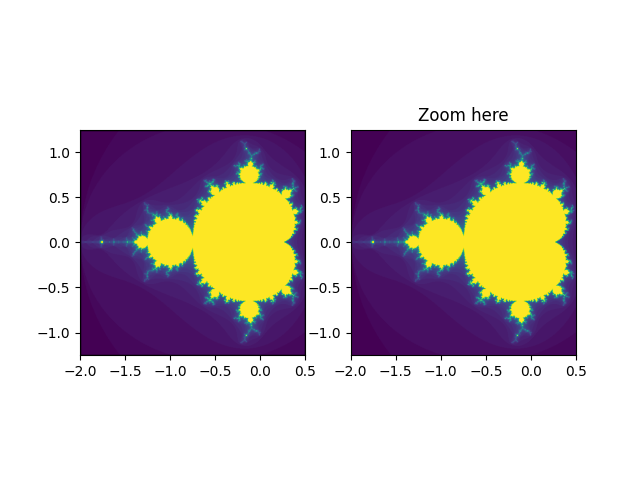
Viewlims #
Crea dos paneles idénticos. Al hacer zoom en el panel derecho, se mostrará un rectángulo en el primer panel, que indica la región ampliada.
Nota
Este ejemplo ejercita las capacidades interactivas de Matplotlib, y esto no aparecerá en la documentación estática. Ejecute este código en su máquina para ver la interactividad.
Puede copiar y pegar partes individuales o descargar el ejemplo completo usando el enlace en la parte inferior de la página.
import numpy as np
import matplotlib.pyplot as plt
from matplotlib.patches import Rectangle


# We just subclass Rectangle so that it can be called with an Axes
# instance, causing the rectangle to update its shape to match the
# bounds of the Axes
class UpdatingRect(Rectangle):
    def __call__(self, ax):
        self.set_bounds(*ax.viewLim.bounds)
        ax.figure.canvas.draw_idle()


# A class that will regenerate a fractal set as we zoom in, so that you
# can actually see the increasing detail.  A box in the left panel will show
# the area to which we are zoomed.
class MandelbrotDisplay:
    def __init__(self, h=500, w=500, niter=50, radius=2., power=2):
        self.height = h
        self.width = w
        self.niter = niter
        self.radius = radius
        self.power = power

    def compute_image(self, xstart, xend, ystart, yend):
        self.x = np.linspace(xstart, xend, self.width)
        self.y = np.linspace(ystart, yend, self.height).reshape(-1, 1)
        c = self.x + 1.0j * self.y
        threshold_time = np.zeros((self.height, self.width))
        z = np.zeros(threshold_time.shape, dtype=complex)
        mask = np.ones(threshold_time.shape, dtype=bool)
        for i in range(self.niter):
            z[mask] = z[mask]**self.power + c[mask]
            mask = (np.abs(z) < self.radius)
            threshold_time += mask
        return threshold_time

    def ax_update(self, ax):
        ax.set_autoscale_on(False)  # Otherwise, infinite loop
        # Get the number of points from the number of pixels in the window
        self.width, self.height = \
            np.round(ax.patch.get_window_extent().size).astype(int)
        # Get the range for the new area
        vl = ax.viewLim
        extent = vl.x0, vl.x1, vl.y0, vl.y1
        # Update the image object with our new data and extent
        im = ax.images[-1]
        im.set_data(self.compute_image(*extent))
        im.set_extent(extent)
        ax.figure.canvas.draw_idle()


md = MandelbrotDisplay()
Z = md.compute_image(-2., 0.5, -1.25, 1.25)

fig1, (ax1, ax2) = plt.subplots(1, 2)
ax1.imshow(Z, origin='lower',
           extent=(md.x.min(), md.x.max(), md.y.min(), md.y.max()))
ax2.imshow(Z, origin='lower',
           extent=(md.x.min(), md.x.max(), md.y.min(), md.y.max()))

rect = UpdatingRect(
    [0, 0], 0, 0, facecolor='none', edgecolor='black', linewidth=1.0)
rect.set_bounds(*ax2.viewLim.bounds)
ax1.add_patch(rect)

# Connect for changing the view limits
ax2.callbacks.connect('xlim_changed', rect)
ax2.callbacks.connect('ylim_changed', rect)

ax2.callbacks.connect('xlim_changed', md.ax_update)
ax2.callbacks.connect('ylim_changed', md.ax_update)
ax2.set_title("Zoom here")

plt.show()