Nota
Haga clic aquí para descargar el código de ejemplo completo
Flecha Demostración #
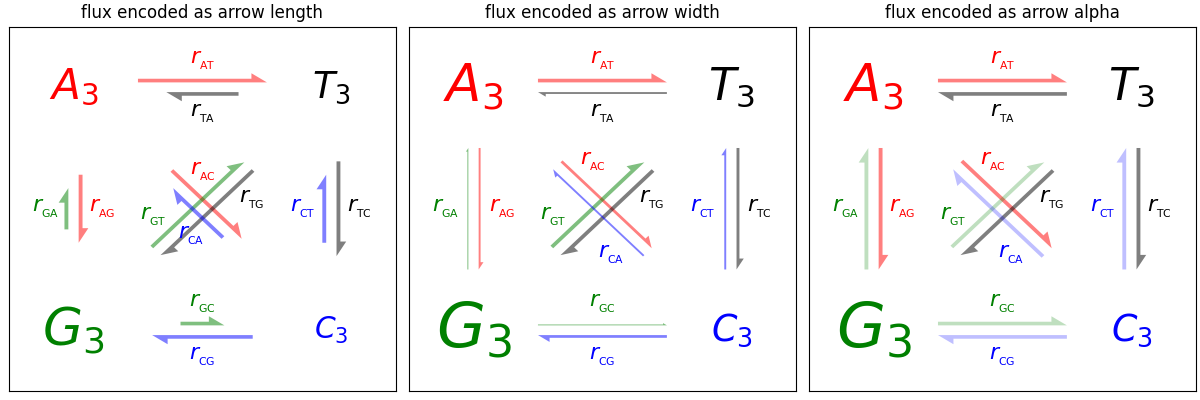
Tres formas de dibujar flechas para codificar la "fuerza" de las flechas (p. ej., probabilidades de transición en un modelo de Markov) utilizando la longitud, el ancho o el alfa (opacidad) de las flechas.

import itertools

import matplotlib.pyplot as plt
import numpy as np


def make_arrow_graph(ax, data, size=4, display='length', shape='right',
                     max_arrow_width=0.03, arrow_sep=0.02, alpha=0.5,
                     normalize_data=False, ec=None, labelcolor=None,
                     **kwargs):
    """
    Makes an arrow plot.

    Parameters
    ----------
    ax
        The axes where the graph is drawn.
    data
        Dict with probabilities for the bases and pair transitions.
    size
        Size of the plot, in inches.
    display : {'length', 'width', 'alpha'}
        The arrow property to change.
    shape : {'full', 'left', 'right'}
        For full or half arrows.
    max_arrow_width : float
        Maximum width of an arrow, in data coordinates.
    arrow_sep : float
        Separation between arrows in a pair, in data coordinates.
    alpha : float
        Maximum opacity of arrows.
    **kwargs
        `.FancyArrow` properties, e.g. *linewidth* or *edgecolor*.
    """

    ax.set(xlim=(-0.25, 1.25), ylim=(-0.25, 1.25), xticks=[], yticks=[],
           title=f'flux encoded as arrow {display}')
    max_text_size = size * 12
    min_text_size = size
    label_text_size = size * 4

    bases = 'ATGC'
    coords = {
        'A': np.array([0, 1]),
        'T': np.array([1, 1]),
        'G': np.array([0, 0]),
        'C': np.array([1, 0]),
    }
    colors = {'A': 'r', 'T': 'k', 'G': 'g', 'C': 'b'}

    for base in bases:
        fontsize = np.clip(max_text_size * data[base]**(1/2),
                           min_text_size, max_text_size)
        ax.text(*coords[base], f'${base}_3$',
                color=colors[base], size=fontsize,
                horizontalalignment='center', verticalalignment='center',
                weight='bold')

    arrow_h_offset = 0.25  # data coordinates, empirically determined
    max_arrow_length = 1 - 2 * arrow_h_offset
    max_head_width = 2.5 * max_arrow_width
    max_head_length = 2 * max_arrow_width
    sf = 0.6  # max arrow size represents this in data coords

    if normalize_data:
        # find maximum value for rates, i.e. where keys are 2 chars long
        max_val = max((v for k, v in data.items() if len(k) == 2), default=0)
        # divide rates by max val, multiply by arrow scale factor
        for k, v in data.items():
            data[k] = v / max_val * sf

    # iterate over strings 'AT', 'TA', 'AG', 'GA', etc.
    for pair in map(''.join, itertools.permutations(bases, 2)):
        # set the length of the arrow
        if display == 'length':
            length = (max_head_length
                      + data[pair] / sf * (max_arrow_length - max_head_length))
        else:
            length = max_arrow_length
        # set the transparency of the arrow
        if display == 'alpha':
            alpha = min(data[pair] / sf, alpha)
        # set the width of the arrow
        if display == 'width':
            scale = data[pair] / sf
            width = max_arrow_width * scale
            head_width = max_head_width * scale
            head_length = max_head_length * scale
        else:
            width = max_arrow_width
            head_width = max_head_width
            head_length = max_head_length

        fc = colors[pair[0]]

        cp0 = coords[pair[0]]
        cp1 = coords[pair[1]]
        # unit vector in arrow direction
        delta = cos, sin = (cp1 - cp0) / np.hypot(*(cp1 - cp0))
        x_pos, y_pos = (
            (cp0 + cp1) / 2  # midpoint
            - delta * length / 2  # half the arrow length
            + np.array([-sin, cos]) * arrow_sep  # shift outwards by arrow_sep
        )
        ax.arrow(
            x_pos, y_pos, cos * length, sin * length,
            fc=fc, ec=ec or fc, alpha=alpha, width=width,
            head_width=head_width, head_length=head_length, shape=shape,
            length_includes_head=True,
            **kwargs
        )

        # figure out coordinates for text:
        # if drawing relative to base: x and y are same as for arrow
        # dx and dy are one arrow width left and up
        orig_positions = {
            'base': [3 * max_arrow_width, 3 * max_arrow_width],
            'center': [length / 2, 3 * max_arrow_width],
            'tip': [length - 3 * max_arrow_width, 3 * max_arrow_width],
        }
        # for diagonal arrows, put the label at the arrow base
        # for vertical or horizontal arrows, center the label
        where = 'base' if (cp0 != cp1).all() else 'center'
        # rotate based on direction of arrow (cos, sin)
        M = [[cos, -sin], [sin, cos]]
        x, y = np.dot(M, orig_positions[where]) + [x_pos, y_pos]
        label = r'$r_{_{\mathrm{%s}}}$' % (pair,)
        ax.text(x, y, label, size=label_text_size, ha='center', va='center',
                color=labelcolor or fc)


if __name__ == '__main__':
    data = {  # test data
        'A': 0.4, 'T': 0.3, 'G': 0.6, 'C': 0.2,
        'AT': 0.4, 'AC': 0.3, 'AG': 0.2,
        'TA': 0.2, 'TC': 0.3, 'TG': 0.4,
        'CT': 0.2, 'CG': 0.3, 'CA': 0.2,
        'GA': 0.1, 'GT': 0.4, 'GC': 0.1,
    }

    size = 4
    fig = plt.figure(figsize=(3 * size, size), constrained_layout=True)
    axs = fig.subplot_mosaic([["length", "width", "alpha"]])

    for display, ax in axs.items():
        make_arrow_graph(
            ax, data, display=display, linewidth=0.001, edgecolor=None,
            normalize_data=True, size=size)

    plt.show()
Tiempo total de ejecución del script: (0 minutos 1.045 segundos)