Nota
Haga clic aquí para descargar el código de ejemplo completo
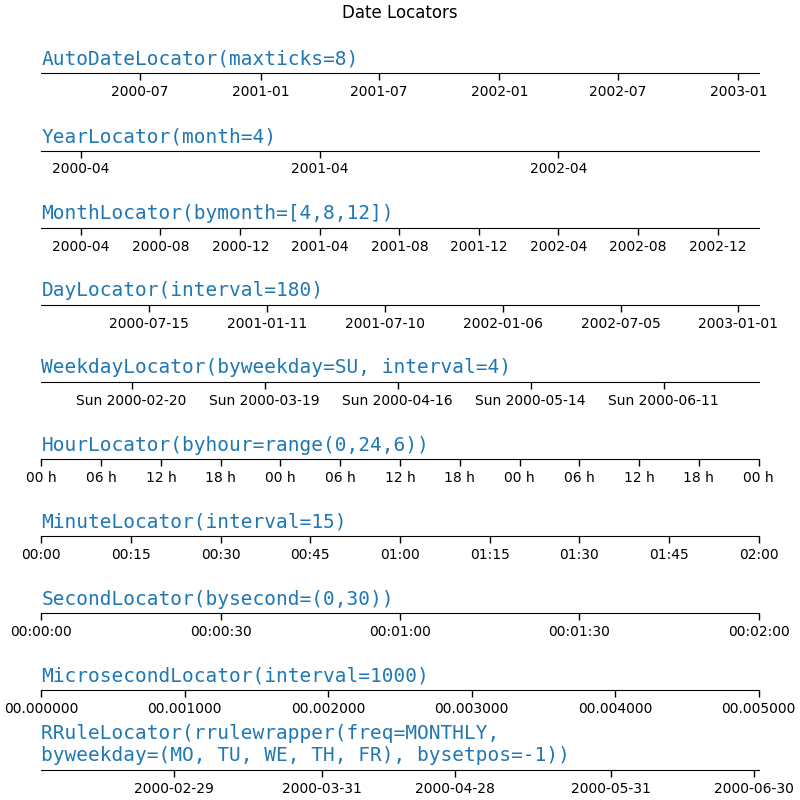
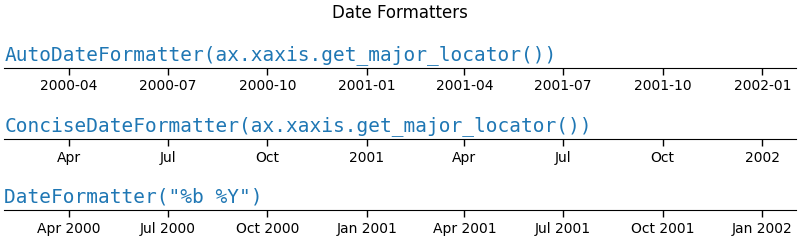
Localizadores de marca de fecha y formateadores #
Este ejemplo ilustra el uso y el efecto de los diversos formateadores y localizadores de fechas.
import numpy as np
import matplotlib.pyplot as plt
import matplotlib.ticker as ticker
from matplotlib.dates import (AutoDateLocator, YearLocator, MonthLocator,
                              DayLocator, WeekdayLocator, HourLocator,
                              MinuteLocator, SecondLocator, MicrosecondLocator,
                              RRuleLocator, rrulewrapper, MONTHLY,
                              MO, TU, WE, TH, FR, SA, SU, DateFormatter,
                              AutoDateFormatter, ConciseDateFormatter)

locators = [
    ('AutoDateLocator(maxticks=8)', '2003-02-01', '%Y-%m'),
    ('YearLocator(month=4)', '2003-02-01', '%Y-%m'),
    ('MonthLocator(bymonth=[4,8,12])', '2003-02-01', '%Y-%m'),
    ('DayLocator(interval=180)', '2003-02-01', '%Y-%m-%d'),
    ('WeekdayLocator(byweekday=SU, interval=4)', '2000-07-01', '%a %Y-%m-%d'),
    ('HourLocator(byhour=range(0,24,6))', '2000-02-04', '%H h'),
    ('MinuteLocator(interval=15)', '2000-02-01 02:00', '%H:%M'),
    ('SecondLocator(bysecond=(0,30))', '2000-02-01 00:02', '%H:%M:%S'),
    ('MicrosecondLocator(interval=1000)', '2000-02-01 00:00:00.005', '%S.%f'),
    ('RRuleLocator(rrulewrapper(freq=MONTHLY, \nbyweekday=(MO, TU, WE, TH,' +
     ' FR), bysetpos=-1))', '2000-07-01', '%Y-%m-%d')
]

formatters = [
    ('AutoDateFormatter(ax.xaxis.get_major_locator())'),
    ('ConciseDateFormatter(ax.xaxis.get_major_locator())'),
    ('DateFormatter("%b %Y")')
]


def plot_axis(ax, locator=None, xmax='2002-02-01', fmt=None, formatter=None):
    """Set up common parameters for the Axes in the example."""
    ax.spines.right.set_visible(False)
    ax.spines.left.set_visible(False)
    ax.spines.top.set_visible(False)
    ax.yaxis.set_major_locator(ticker.NullLocator())
    ax.tick_params(which='major', width=1.00, length=5)
    ax.tick_params(which='minor', width=0.75, length=2.5)
    ax.set_xlim(np.datetime64('2000-02-01'), np.datetime64(xmax))
    if locator:
        ax.xaxis.set_major_locator(eval(locator))
        ax.xaxis.set_major_formatter(DateFormatter(fmt))
    else:
        ax.xaxis.set_major_formatter(eval(formatter))
    ax.text(0.0, 0.2, locator or formatter, transform=ax.transAxes,
            fontsize=14, fontname='Monospace', color='tab:blue')


fig, ax = plt.subplots(len(locators), 1, figsize=(8, len(locators) * .8),
                       layout='constrained')
fig.suptitle('Date Locators')
for i, loc in enumerate(locators):
    plot_axis(ax[i], *loc)

fig, ax = plt.subplots(len(formatters), 1, figsize=(8, len(formatters) * .8),
                       layout='constrained')
fig.suptitle('Date Formatters')
for i, fmt in enumerate(formatters):
    plot_axis(ax[i], formatter=fmt)
Referencias
En este ejemplo se muestra el uso de las siguientes funciones, métodos, clases y módulos:
Tiempo total de ejecución del script: (0 minutos 2.097 segundos)