Nota
Haga clic aquí para descargar el código de ejemplo completo
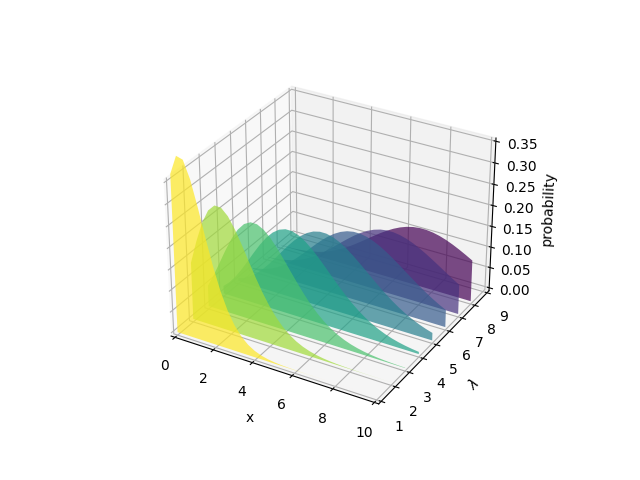
Genere polígonos para llenar bajo el gráfico de líneas 3D #
Demuestre cómo crear polígonos que llenen el espacio debajo de un gráfico lineal. En este ejemplo, los polígonos son semitransparentes, lo que crea una especie de efecto de "vidrieras dentadas".
from matplotlib.collections import PolyCollection
import matplotlib.pyplot as plt
import math
import numpy as np

# Fixing random state for reproducibility
np.random.seed(19680801)


def polygon_under_graph(x, y):
    """
    Construct the vertex list which defines the polygon filling the space under
    the (x, y) line graph. This assumes x is in ascending order.
    """
    return [(x[0], 0.), *zip(x, y), (x[-1], 0.)]


ax = plt.figure().add_subplot(projection='3d')

x = np.linspace(0., 10., 31)
lambdas = range(1, 9)

# verts[i] is a list of (x, y) pairs defining polygon i.
gamma = np.vectorize(math.gamma)
verts = [polygon_under_graph(x, l**x * np.exp(-l) / gamma(x + 1))
         for l in lambdas]
facecolors = plt.colormaps['viridis_r'](np.linspace(0, 1, len(verts)))

poly = PolyCollection(verts, facecolors=facecolors, alpha=.7)
ax.add_collection3d(poly, zs=lambdas, zdir='y')

ax.set(xlim=(0, 10), ylim=(1, 9), zlim=(0, 0.35),
       xlabel='x', ylabel=r'$\lambda$', zlabel='probability')

plt.show()