Nota
Haga clic aquí para descargar el código de ejemplo completo
Creación de mapas de calor anotados #
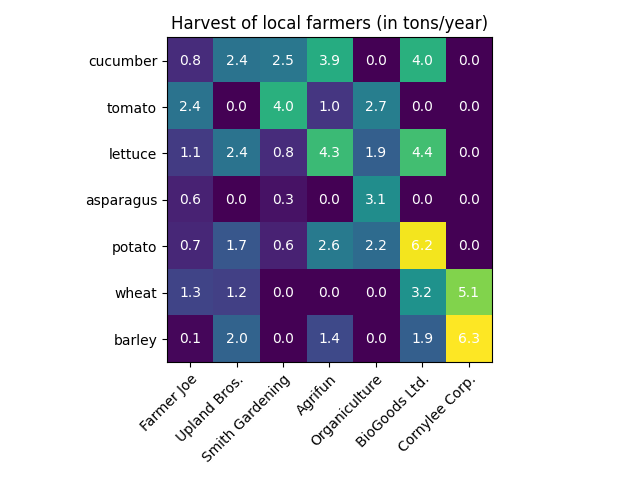
A menudo es deseable mostrar los datos que dependen de dos variables independientes como un gráfico de imagen codificado por colores. Esto a menudo se denomina mapa de calor. Si los datos son categóricos, esto se llamaría un mapa de calor categórico.
La función de Matplotlib imshowhace que la producción de dichos gráficos sea particularmente fácil.
Los siguientes ejemplos muestran cómo crear un mapa de calor con anotaciones. Comenzaremos con un ejemplo fácil y lo expandiremos para que se pueda usar como una función universal.
Un mapa de calor categórico simple #
Podemos comenzar definiendo algunos datos. Lo que necesitamos es una lista o matriz 2D que defina los datos en un código de color. Entonces también necesitamos dos listas o arreglos de categorías; por supuesto, la cantidad de elementos en esas listas debe coincidir con los datos a lo largo de los ejes respectivos. El mapa de calor en sí es una imshowtrama con las etiquetas establecidas en las categorías que tenemos. Tenga en cuenta que es importante establecer tanto las ubicaciones de las marcas ( ) set_xtickscomo las etiquetas de las marcas ( set_xticklabels), de lo contrario, no estarían sincronizadas. Las ubicaciones son solo los números enteros ascendentes, mientras que las etiquetas de verificación son las etiquetas que se muestran. Finalmente, podemos etiquetar los datos en sí mismos creando un Text
dentro de cada celda que muestre el valor de esa celda.
import numpy as np
import matplotlib
import matplotlib as mpl
import matplotlib.pyplot as plt

vegetables = ["cucumber", "tomato", "lettuce", "asparagus",
              "potato", "wheat", "barley"]
farmers = ["Farmer Joe", "Upland Bros.", "Smith Gardening",
           "Agrifun", "Organiculture", "BioGoods Ltd.", "Cornylee Corp."]

harvest = np.array([[0.8, 2.4, 2.5, 3.9, 0.0, 4.0, 0.0],
                    [2.4, 0.0, 4.0, 1.0, 2.7, 0.0, 0.0],
                    [1.1, 2.4, 0.8, 4.3, 1.9, 4.4, 0.0],
                    [0.6, 0.0, 0.3, 0.0, 3.1, 0.0, 0.0],
                    [0.7, 1.7, 0.6, 2.6, 2.2, 6.2, 0.0],
                    [1.3, 1.2, 0.0, 0.0, 0.0, 3.2, 5.1],
                    [0.1, 2.0, 0.0, 1.4, 0.0, 1.9, 6.3]])


fig, ax = plt.subplots()
im = ax.imshow(harvest)

# Show all ticks and label them with the respective list entries
ax.set_xticks(np.arange(len(farmers)), labels=farmers)
ax.set_yticks(np.arange(len(vegetables)), labels=vegetables)

# Rotate the tick labels and set their alignment.
plt.setp(ax.get_xticklabels(), rotation=45, ha="right",
         rotation_mode="anchor")

# Loop over data dimensions and create text annotations.
for i in range(len(vegetables)):
    for j in range(len(farmers)):
        text = ax.text(j, i, harvest[i, j],
                       ha="center", va="center", color="w")

ax.set_title("Harvest of local farmers (in tons/year)")
fig.tight_layout()
plt.show()

Usando el estilo de código de la función auxiliar #
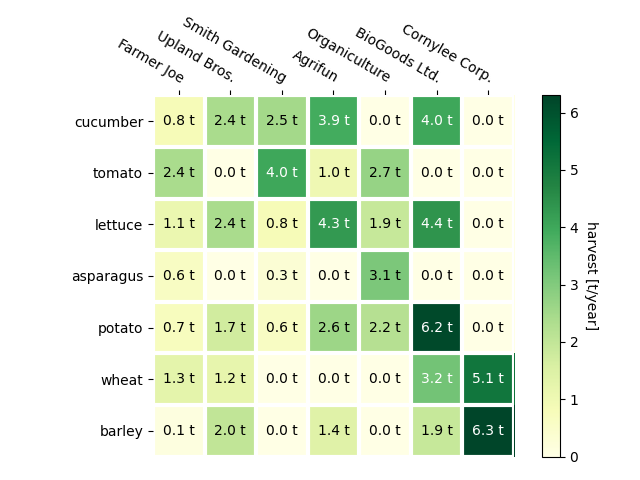
Como se discutió en los estilos de codificación, es posible que desee reutilizar dicho código para crear algún tipo de mapa de calor para diferentes datos de entrada y/o en diferentes ejes. Creamos una función que toma los datos y las etiquetas de fila y columna como entrada, y permite argumentos que se usan para personalizar la gráfica.
Aquí, además de lo anterior, también queremos crear una barra de colores y colocar las etiquetas encima del mapa de calor en lugar de debajo. Las anotaciones obtendrán diferentes colores según un umbral para un mejor contraste con el color del píxel. Finalmente, apagamos las espinas de los ejes circundantes y creamos una cuadrícula de líneas blancas para separar las celdas.
def heatmap(data, row_labels, col_labels, ax=None,
            cbar_kw=None, cbarlabel="", **kwargs):
    """
    Create a heatmap from a numpy array and two lists of labels.

    Parameters
    ----------
    data
        A 2D numpy array of shape (M, N).
    row_labels
        A list or array of length M with the labels for the rows.
    col_labels
        A list or array of length N with the labels for the columns.
    ax
        A `matplotlib.axes.Axes` instance to which the heatmap is plotted.  If
        not provided, use current axes or create a new one.  Optional.
    cbar_kw
        A dictionary with arguments to `matplotlib.Figure.colorbar`.  Optional.
    cbarlabel
        The label for the colorbar.  Optional.
    **kwargs
        All other arguments are forwarded to `imshow`.
    """

    if ax is None:
        ax = plt.gca()

    if cbar_kw is None:
        cbar_kw = {}

    # Plot the heatmap
    im = ax.imshow(data, **kwargs)

    # Create colorbar
    cbar = ax.figure.colorbar(im, ax=ax, **cbar_kw)
    cbar.ax.set_ylabel(cbarlabel, rotation=-90, va="bottom")

    # Show all ticks and label them with the respective list entries.
    ax.set_xticks(np.arange(data.shape[1]), labels=col_labels)
    ax.set_yticks(np.arange(data.shape[0]), labels=row_labels)

    # Let the horizontal axes labeling appear on top.
    ax.tick_params(top=True, bottom=False,
                   labeltop=True, labelbottom=False)

    # Rotate the tick labels and set their alignment.
    plt.setp(ax.get_xticklabels(), rotation=-30, ha="right",
             rotation_mode="anchor")

    # Turn spines off and create white grid.
    ax.spines[:].set_visible(False)

    ax.set_xticks(np.arange(data.shape[1]+1)-.5, minor=True)
    ax.set_yticks(np.arange(data.shape[0]+1)-.5, minor=True)
    ax.grid(which="minor", color="w", linestyle='-', linewidth=3)
    ax.tick_params(which="minor", bottom=False, left=False)

    return im, cbar


def annotate_heatmap(im, data=None, valfmt="{x:.2f}",
                     textcolors=("black", "white"),
                     threshold=None, **textkw):
    """
    A function to annotate a heatmap.

    Parameters
    ----------
    im
        The AxesImage to be labeled.
    data
        Data used to annotate.  If None, the image's data is used.  Optional.
    valfmt
        The format of the annotations inside the heatmap.  This should either
        use the string format method, e.g. "$ {x:.2f}", or be a
        `matplotlib.ticker.Formatter`.  Optional.
    textcolors
        A pair of colors.  The first is used for values below a threshold,
        the second for those above.  Optional.
    threshold
        Value in data units according to which the colors from textcolors are
        applied.  If None (the default) uses the middle of the colormap as
        separation.  Optional.
    **kwargs
        All other arguments are forwarded to each call to `text` used to create
        the text labels.
    """

    if not isinstance(data, (list, np.ndarray)):
        data = im.get_array()

    # Normalize the threshold to the images color range.
    if threshold is not None:
        threshold = im.norm(threshold)
    else:
        threshold = im.norm(data.max())/2.

    # Set default alignment to center, but allow it to be
    # overwritten by textkw.
    kw = dict(horizontalalignment="center",
              verticalalignment="center")
    kw.update(textkw)

    # Get the formatter in case a string is supplied
    if isinstance(valfmt, str):
        valfmt = matplotlib.ticker.StrMethodFormatter(valfmt)

    # Loop over the data and create a `Text` for each "pixel".
    # Change the text's color depending on the data.
    texts = []
    for i in range(data.shape[0]):
        for j in range(data.shape[1]):
            kw.update(color=textcolors[int(im.norm(data[i, j]) > threshold)])
            text = im.axes.text(j, i, valfmt(data[i, j], None), **kw)
            texts.append(text)

    return texts
Lo anterior ahora nos permite mantener la creación de la trama real bastante compacta.
fig, ax = plt.subplots()

im, cbar = heatmap(harvest, vegetables, farmers, ax=ax,
                   cmap="YlGn", cbarlabel="harvest [t/year]")
texts = annotate_heatmap(im, valfmt="{x:.1f} t")

fig.tight_layout()
plt.show()

Algunos ejemplos de mapas de calor más complejos #
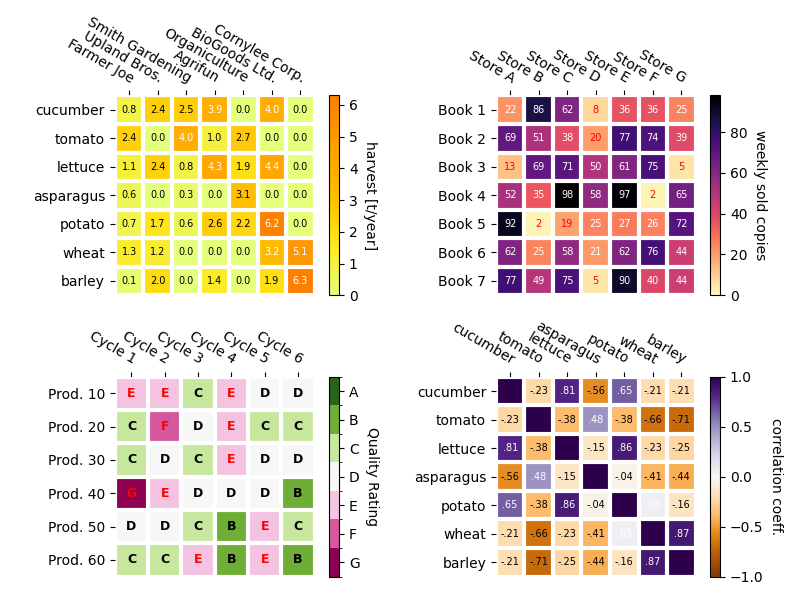
A continuación mostramos la versatilidad de las funciones creadas anteriormente aplicándolas en diferentes casos y usando diferentes argumentos.
np.random.seed(19680801)

fig, ((ax, ax2), (ax3, ax4)) = plt.subplots(2, 2, figsize=(8, 6))

# Replicate the above example with a different font size and colormap.

im, _ = heatmap(harvest, vegetables, farmers, ax=ax,
                cmap="Wistia", cbarlabel="harvest [t/year]")
annotate_heatmap(im, valfmt="{x:.1f}", size=7)

# Create some new data, give further arguments to imshow (vmin),
# use an integer format on the annotations and provide some colors.

data = np.random.randint(2, 100, size=(7, 7))
y = ["Book {}".format(i) for i in range(1, 8)]
x = ["Store {}".format(i) for i in list("ABCDEFG")]
im, _ = heatmap(data, y, x, ax=ax2, vmin=0,
                cmap="magma_r", cbarlabel="weekly sold copies")
annotate_heatmap(im, valfmt="{x:d}", size=7, threshold=20,
                 textcolors=("red", "white"))

# Sometimes even the data itself is categorical. Here we use a
# `matplotlib.colors.BoundaryNorm` to get the data into classes
# and use this to colorize the plot, but also to obtain the class
# labels from an array of classes.

data = np.random.randn(6, 6)
y = ["Prod. {}".format(i) for i in range(10, 70, 10)]
x = ["Cycle {}".format(i) for i in range(1, 7)]

qrates = list("ABCDEFG")
norm = matplotlib.colors.BoundaryNorm(np.linspace(-3.5, 3.5, 8), 7)
fmt = matplotlib.ticker.FuncFormatter(lambda x, pos: qrates[::-1][norm(x)])

im, _ = heatmap(data, y, x, ax=ax3,
                cmap=mpl.colormaps["PiYG"].resampled(7), norm=norm,
                cbar_kw=dict(ticks=np.arange(-3, 4), format=fmt),
                cbarlabel="Quality Rating")

annotate_heatmap(im, valfmt=fmt, size=9, fontweight="bold", threshold=-1,
                 textcolors=("red", "black"))

# We can nicely plot a correlation matrix. Since this is bound by -1 and 1,
# we use those as vmin and vmax. We may also remove leading zeros and hide
# the diagonal elements (which are all 1) by using a
# `matplotlib.ticker.FuncFormatter`.

corr_matrix = np.corrcoef(harvest)
im, _ = heatmap(corr_matrix, vegetables, vegetables, ax=ax4,
                cmap="PuOr", vmin=-1, vmax=1,
                cbarlabel="correlation coeff.")


def func(x, pos):
    return "{:.2f}".format(x).replace("0.", ".").replace("1.00", "")

annotate_heatmap(im, valfmt=matplotlib.ticker.FuncFormatter(func), size=7)


plt.tight_layout()
plt.show()

Referencias
En este ejemplo se muestra el uso de las siguientes funciones, métodos, clases y módulos:
Tiempo total de ejecución del script: (0 minutos 2.652 segundos)