Nota
Haga clic aquí para descargar el código de ejemplo completo
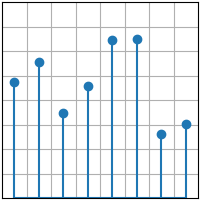
tallo (x, y) #
ver stem_
import matplotlib.pyplot as plt
import numpy as np

plt.style.use('_mpl-gallery')

# make data
np.random.seed(3)
x = 0.5 + np.arange(8)
y = np.random.uniform(2, 7, len(x))

# plot
fig, ax = plt.subplots()

ax.stem(x, y)

ax.set(xlim=(0, 8), xticks=np.arange(1, 8),
       ylim=(0, 8), yticks=np.arange(1, 8))

plt.show()