Nota
Haga clic aquí para descargar el código de ejemplo completo
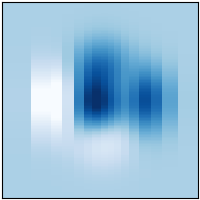
pcolormesh(X, Y, Z) #
pcolormeshes más flexible que imshowen el sentido de que los vectores x e y no necesitan estar igualmente espaciados (de hecho, pueden estar sesgados).
import matplotlib.pyplot as plt
import numpy as np

plt.style.use('_mpl-gallery-nogrid')

# make data with uneven sampling in x
x = [-3, -2, -1.6, -1.2, -.8, -.5, -.2, .1, .3, .5, .8, 1.1, 1.5, 1.9, 2.3, 3]
X, Y = np.meshgrid(x, np.linspace(-3, 3, 128))
Z = (1 - X/2 + X**5 + Y**3) * np.exp(-X**2 - Y**2)

# plot
fig, ax = plt.subplots()

ax.pcolormesh(X, Y, Z, vmin=-0.5, vmax=1.0)

plt.show()